
Figure 2. In vivo imaging WT and CAR-KO neutrophils co-adoptively transferred into arthritic WT mice.
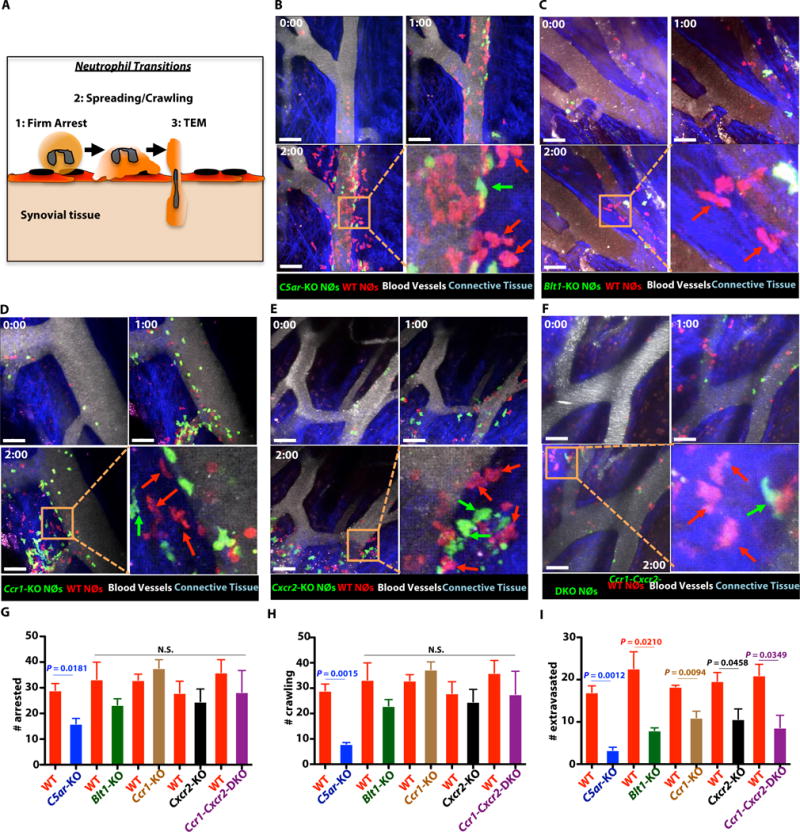
(A) Schematic of neutrophil migration cascade. (B–F) In vivo imaging of the joint after co-adoptive transfer of WT-Actin-RFP and CAR-KO-Actin-GFP purified neutrophils into WT mice that received AST 7 days prior. Data are representative of 3 independent experiments. (B) WT and C5ar-KO, (C) WT and Blt1-KO (D), WT and Ccr1-KO (E), WT and Cxcr2-KO and (F) WT and Ccr1-Cxcr2-DKO neutrophils. GFP: CAR-KO neutrophils; RFP: WT neutrophil; Blue: connective tissue; Qdots: Blood vessels. Scale bars represent 50 μm. Time in hrs:mins. Green arrows shows extravasated CAR-KO neutrophils, and red arrows show extravasated WT neutrophils. (G–I) Quantitation of the number of new (G) arrested, (H) crawling, and (I) extravasated neutrophils; in the joint during the 120 min observed. Data indicate mean ± SEM. n = 3 mice/group, P value calculated using unpaired two-tails Student’s t-test. N.S.- not statistically significant.