
Figure 4. C5aR and CCR1 mediate interactions of neutrophils with the joint endothelium at different stages of the adhesion cascade.
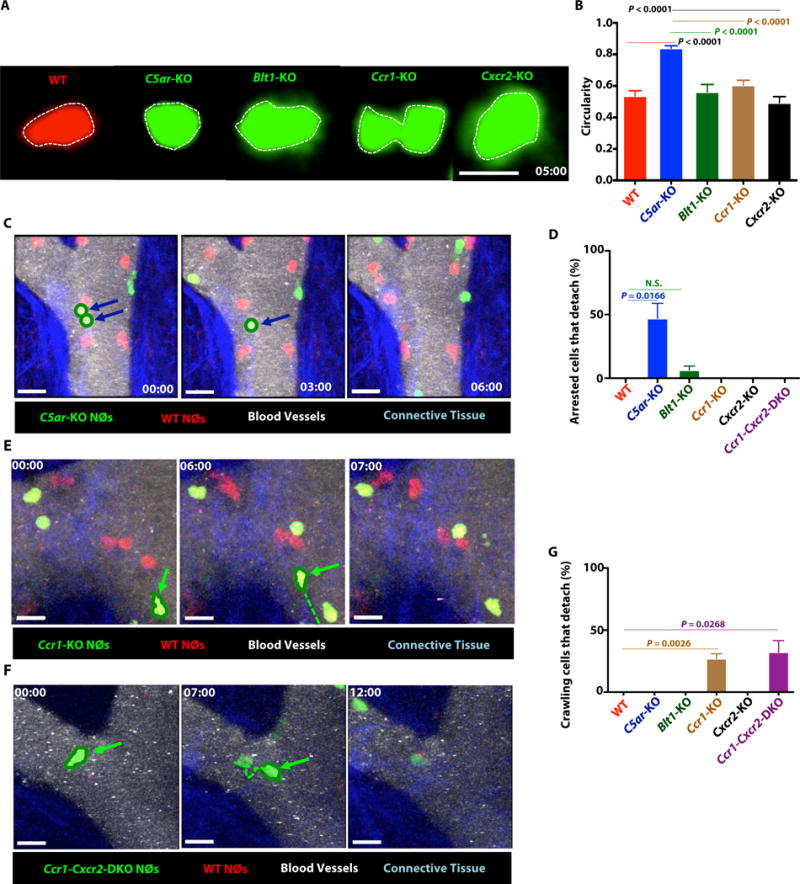
(A) Shape of WT and CAR-KO neutrophils 5 min after arrest. Broken white line outlines the shape of the neutrophils. Scale bars represent 10 μm. (B) Circularity of WT and CAR-KO neutrophils 5 mins after arrest. Data indicate mean ± SEM; n= 10 cells/genotype (C–G) In vivo joint imaging after adoptive transfer of WT-Actin-RFP and CAR-KO-Actin-GFP neutrophils into WT mice that received AST 7 days prior. Blue: Connective tissue; Qdots: Blood vessels. (C) WT and C5ar-KO neutrophils. Blue arrows indicate arrested cells that detached. Time in mins:secs. Scale bars represent 10 μm. Data are representative of 3 independent experiments. (D) Quantitation of arrested cell that detached from the joint endothelium over 120 mins observation. (E) WT and Ccr1-KO and (F) WT and Ccr1-Cxcr2-DKO neutrophils. Green arrow indicates crawling cells that detach. Green broken line indicates the track of a mobile cell. Time in mins:secs. Scale bars represent 10 μm. (G) Quantitation of crawling cells that detach from the joint endothelium over 120 mins of observation (C,E, F) Data are representative of 3 independent experiments. (D, G) Data indicate mean ± SEM; n = 3 mice/group; P value calculated using unpaired two-tails Student’s t-test. N.S.- not statistically significant.