Figure 2.

Wallerian degeneration is protracted in the central nervous system.
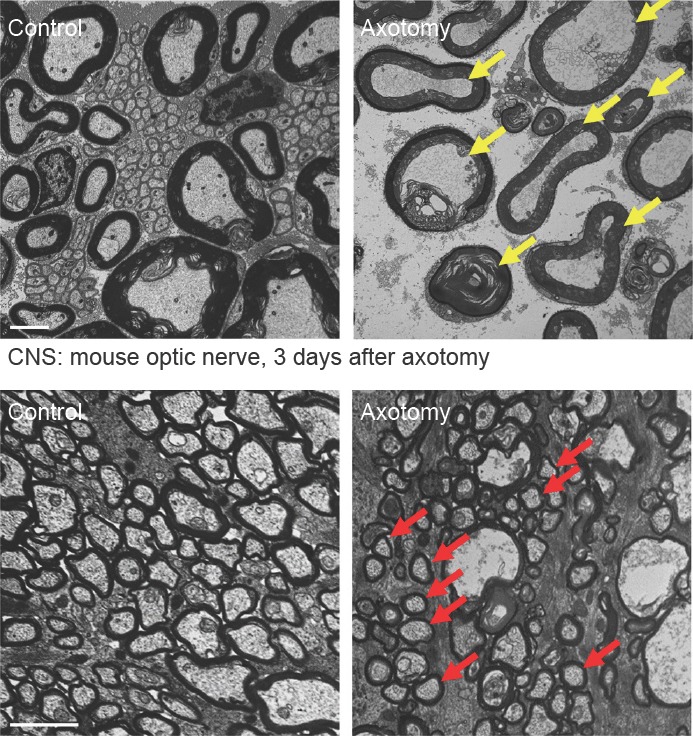
Transmission electron microscopy of control and axotomized transverse mouse sciatic nerves (upper row) and optic nerves (lower row) representing Wallerian degeneration of the peripheral nervous system (PNS) and central nervous system (CNS), respectively. Note complete degeneration of all PNS axons with granular disintegration of the axoplasm in the distal nerve stump three days following axotomy (yellow arrows depict examples). In contrast, many CNS axons are structurally preserved three days following optic nerve axotomy (red arrows depict examples). This indicates that Wallerian degeneration of axons progresses slower in the CNS than in the PNS. Scale bars: 2 μm.
