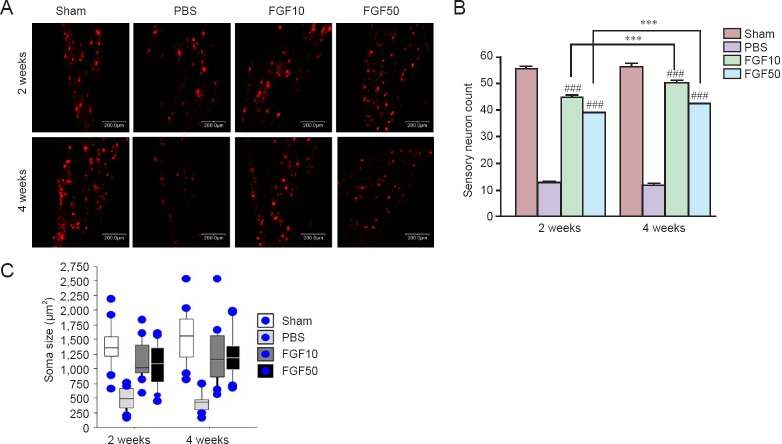
Figure 5.
Retrograde tracing of the trigeminal ganglion with Dil.
(A) Sensory neurons (red) determined by DiI staining in the trigeminal ganglion. (B) Quantification and statistical significance of the cell count (###P < 0.001, vs. PBS group; ***P < 0.001). (C) Soma sizes (μm2) in each group. The retrogradely labeled neurons had larger soma in the rhFGF2-treated groups than in the PBS group (P < 0.001, FGF10 and FGF50 groups vs. PBS group at 2 and 4 weeks). Scale bars: 200 μm. Data in (B) and (C) are expressed as the mean ± SEM. Sham: Sham-operated (normal control); PBS: PBS treatment after mental nerve crush injury; FGF10 and FGF50: rhFGF2 treatment (10 and 50 μg/mL, respectively) after mental nerve crush injury.

