
Fig. 2.
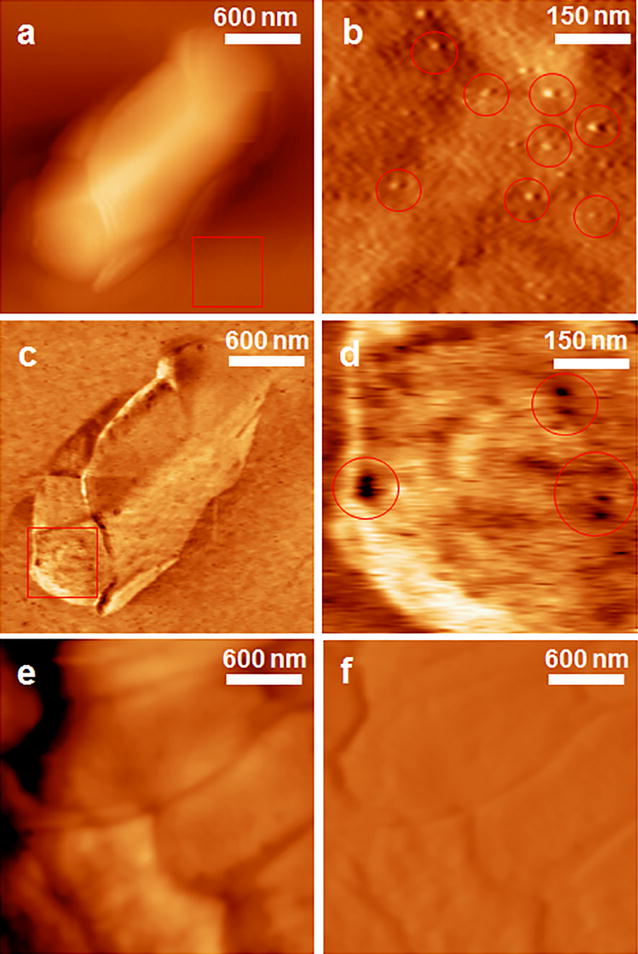
The representative AFM topography and recognition images of S. typhimurium and E. coli in water, obtained by the APT33 attached to AFM tip and on CD-modified Au(111) surface. a The topography images of S. typhimurium. b The enlarged topography image shows the aptamers on the CD-modified Au(111) surface within the red frame in a. Some representative aptamer molecules were highlighted with red circles. c The corresponding recognition image of S. typhimurium. d The enlarged recognition image of the surface area within the red frame in c. The dark spots in the red circles show the location of OMPs. e The topography image of E. coli in water. f The corresponding recognition images of E. coli. The images of a, c, e, and f have the same size of 2.4 μm by 2.4 μm. The images of b and d have the same size of 600 nm by 600 nm