Fig. 2.

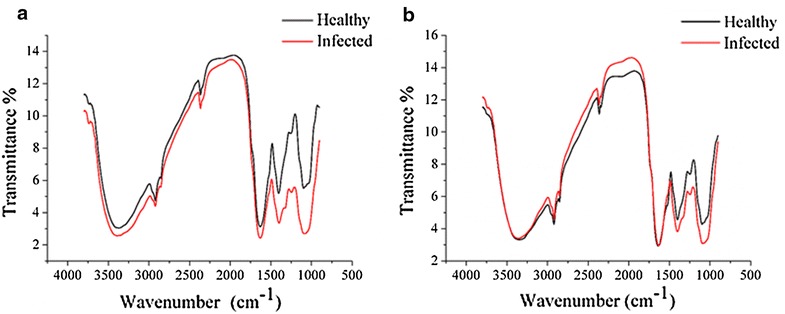
Average spectra of healthy and infected leaves of sample set 1 (a), and average spectra of healthy and infected leaves of sample set 2 (b). The differences of healthy and infected leaves of two sample sets could be observed

Average spectra of healthy and infected leaves of sample set 1 (a), and average spectra of healthy and infected leaves of sample set 2 (b). The differences of healthy and infected leaves of two sample sets could be observed