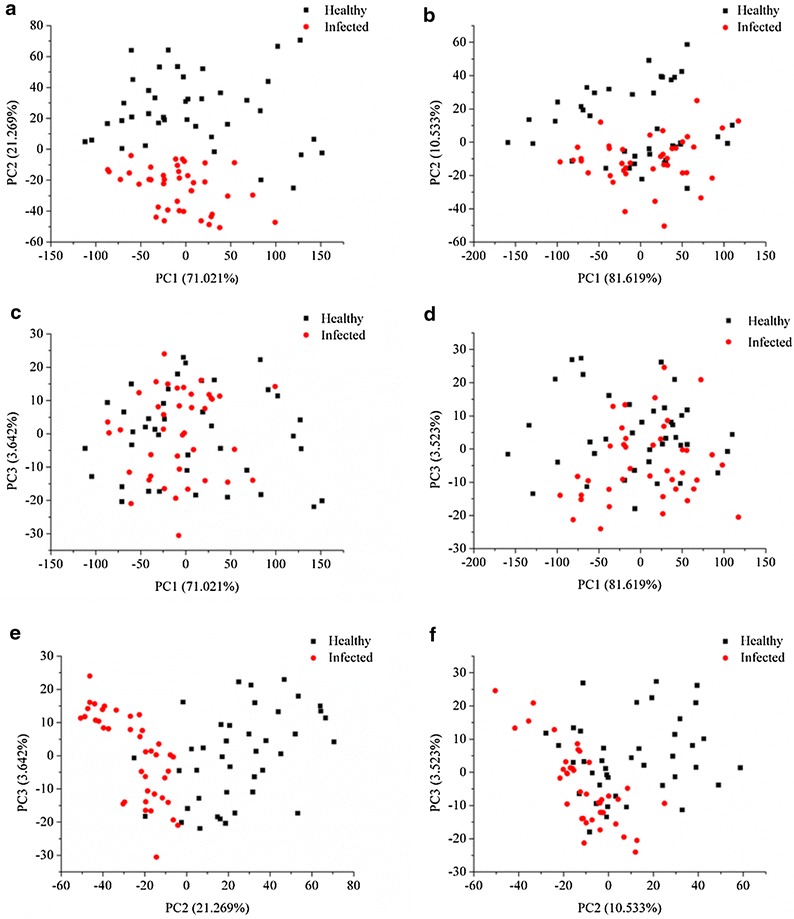
Fig. 3.

Scores scatter plot of PC1 versus PC2 (a), PC1 versus PC3 (c) and PC2 versus PC3 (e) of sample set 1, and scores scatter plot of PC1 versus PC2 (b), PC1 versus PC3 (d) and PC2 versus PC3 (f) of sample set 2. The plots were used to explore the separability between healthy and infected samples qualitatively
