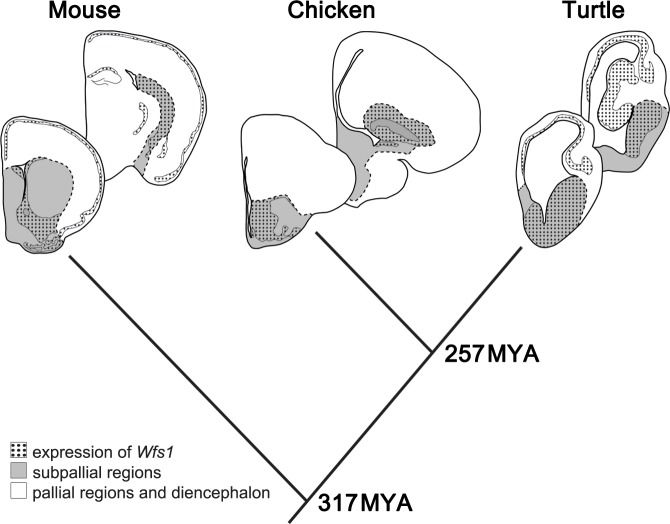
Fig 8. The expression of Wfs1 in pallial and subpallial regions of mouse, chick and red-eared slider turtle brain.
Schematic depiction of the expression of Wfs1 (dotted area) in pallial (white) and subpallial (grey) regions of mouse, chick and red-eared slider turtle brain. Coronal sections. Times of evolutionary divergence are based on [37]. Dashed line—border delineating subpallial regions.

