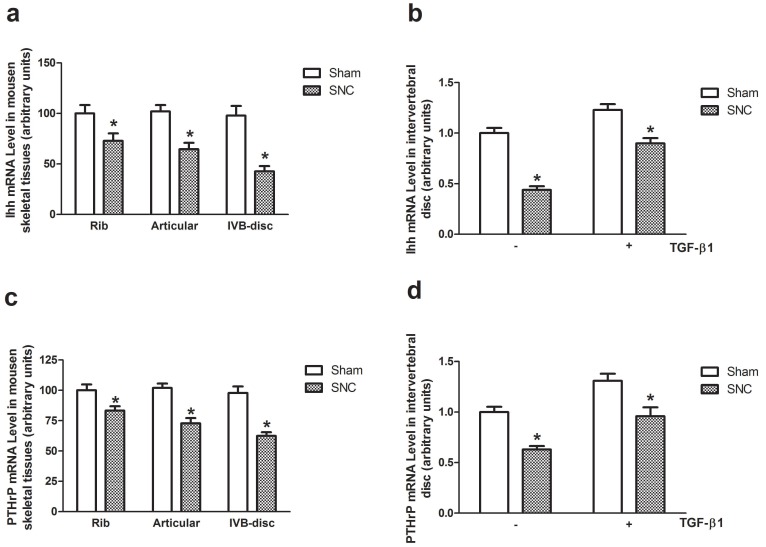
Figure 4.
The Ihh and PTHrP gene expression. The effects of denervation on Ihh (a) and PTHrP (c) mRNA levels. Data expressed as mean ± SEM (n = 7) with * p < 0.05, SNC vs sham by Student's t-test. The effects of rhTGF-β1 on Ihh (b) and PTHrP (d) mRNA levels. Data expressed as mean ± SEM (n = 7), * p < 0.05 with different letter among all groups by ANOVA.

