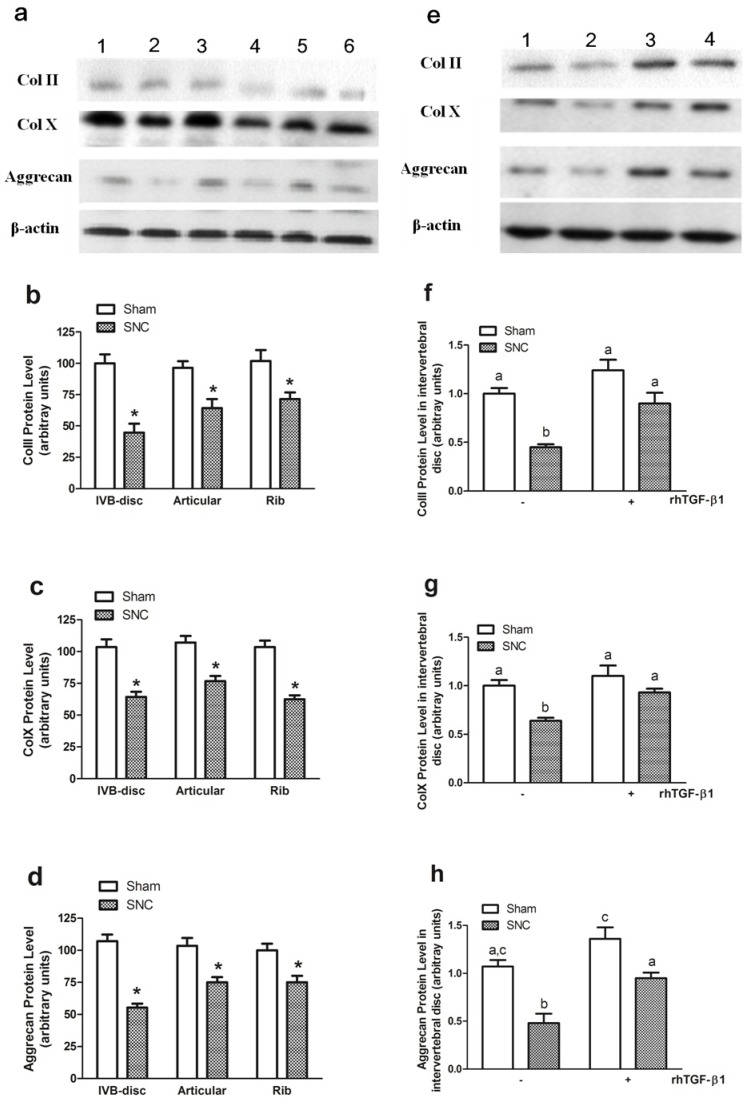
Figure 5.
ColII, ColX and aggrecan protein levels. (a) A representative autoradiograph of Western blots signals in intervertebral disc (lane a1 and a2), rib cartilage (lane a3 and a4) and articular cartilage (lane a5 and a6) in Sham (lane a1, a3 and a5 for ColII and aggrecan; lane a1, a3 and a6 for ColX) and SNC (lane a2, a4 and a6 for ColII and aggrecan; lane a2, a4 and a5 for ColX ) mice.(b) ColII, (c) ColX and (d) Aggrecan protein level after sciatic nerve crush. (e) A representative autoradiograph of Western blots signals in intervertebral disc of mice with treatment of sham (lane e1), SNC-vehicle (lane e2), sham-rhTGF-β1 (lane e3 for ColII and aggrecan; lane e4 for ColX) and SNC-rhTGF-β1 (lane e4 for ColII and aggrecan; lane e3 for ColX). (f) ColII, (g) ColX and (h) Aggrecan protein level in intervertebral disc of mice with treatment rhTGF-β1. Data are means ± SEM (n = 7) with * p < 0.05, sham vs SNC by Student's t-test for (b-d) and with different letter among all groups by ANOVA for (f-h).

