
Figure 1.
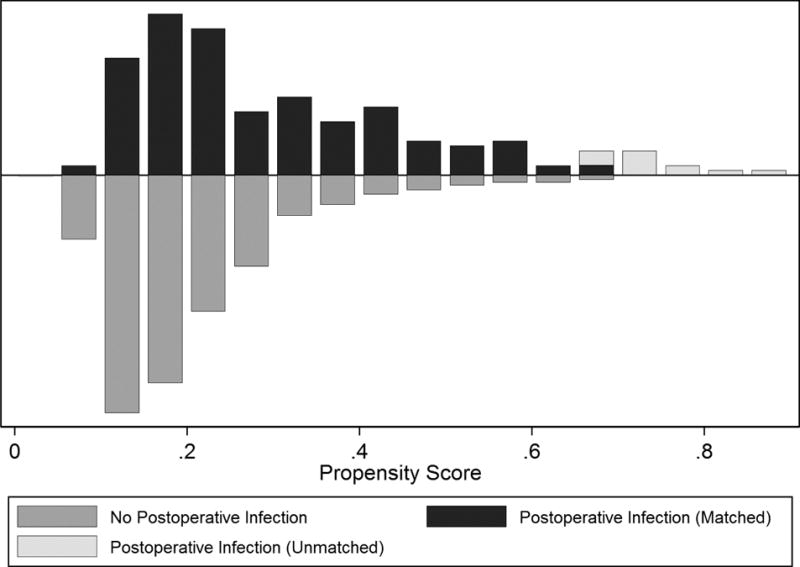
Mirrored histogram depicting balance of patients with and without post-operative infection across propensity scores. (x = propensity score ~ risk of developing an infection, y= number of patients)
Official websites use .gov
A
.gov website belongs to an official
government organization in the United States.
Secure .gov websites use HTTPS
A lock (
) or https:// means you've safely
connected to the .gov website. Share sensitive
information only on official, secure websites.
Mirrored histogram depicting balance of patients with and without post-operative infection across propensity scores. (x = propensity score ~ risk of developing an infection, y= number of patients)