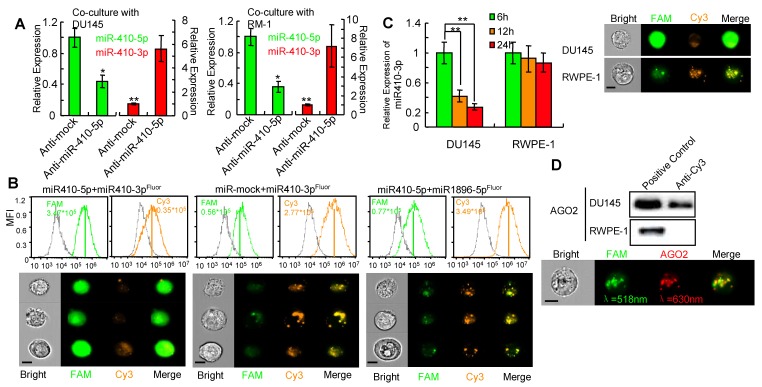
Figure 3.
miR-410-5p promotes miR-410-3p degradation in vivo. A. Levels of both miR-410-5p and miR-410-3p in DCs transfected with either anti-mock or anti-miR-410-5p, which were co-cultured with DU145 cells (left panel) or RM-1 cells (right panel), respectively. The data are presented as the mean ± SD of three independent experiments, ** P < 0.01. B. Representative results of the in vivo cellular localization of FAM (Ex: 488 nm, Em: 516 nm), and Cy3 (Ex: 508-532 nm, Em: 568 nm) in DCs analyzed by real-time imaging flow cytometry (Amnis image stream mkII) 6 h after co-transfection with labeled miRNAs. The values of the MFI are shown. Scale bars represent 10 μm. C. miR-410-3pFluor in transfected DU145 and RWPE-1 cells analyzed by real-time imaging flow cytometry (Amnis image stream mkII) (right panel), and miR-410-3p levels evaluated by qRT-PCR at different time points after transfection (left panel). The data are presented as the mean ± SD of three independent experiments, ** P < 0.01. Scale bars represent 10 μm. D. AGO2 was found in the immunoprecipitated complexes with anti-Cy3 derived from DU145 cells but not from RWPE-1 cells that were transfected with miR-410-3pFluor (upper panel). Dual staining in DU145 cells confirmed the results of real-time imaging flow cytometry (Amnis image stream mkII) (lower panel). Scale bars represent 10 μm.

