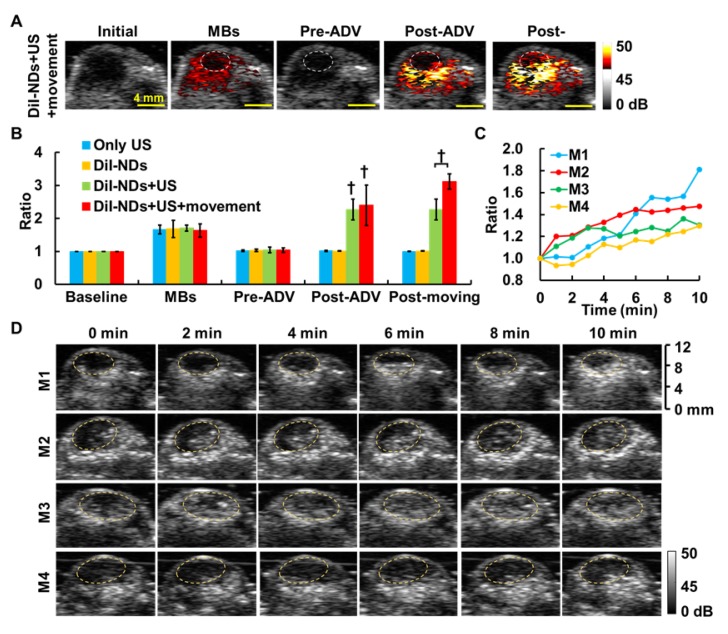
Figure 6.
(A) The US enhancement images of solid tumors in the DiI-NDs+US+movement group. The post-movement image shows enhancement of ADV-B accumulation in the poorly perfused region (dotted circles). (B) The ratios of gray level within tumors in various experimental groups († p<0.01). (C) The ratios of gray level within the poorly perfused regions and (D) corresponding US images for four tumor-bearing mice during ADV-B formation and movement. The dotted circles indicate the poorly perfused regions defined by MB perfusion imaging.

