Figure 1.
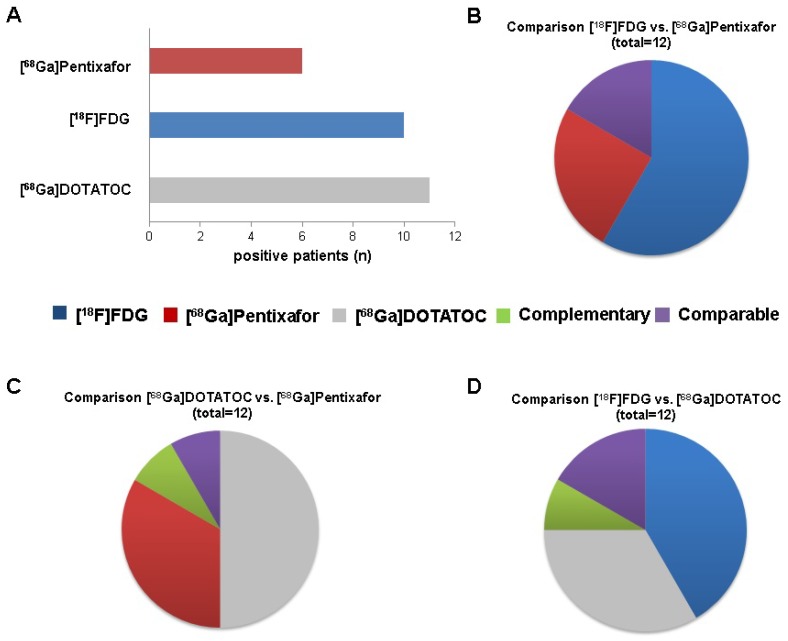
Visual comparison of [68Ga]Pentixafor, 68Ga-DOTA-D-Phe-Tyr3-octreotide ([68Ga]DOTATOC) and 18F-fluorodeoxy-glucose ([18F]FDG) PET scans (whole cohort).The individual tracer´s superiority over another was defined on a per-lesion basis, i.e. the tracer depicting the highest number of tumor lesions was considered superior. Comparability of two tracers was present when both detected the same number of identical lesions. Complementarity was defined of presence of sites of disease exclusively detected by one of the two compared tracers, respectively. A. Number of patients with visual positivity for the indicated PET tracer (total, n=12). B. Number of patients (total, n=12) for whom imaging with [18F]FDG (n=7) or [68Ga]Pentixafor (n=3) was superior, with comparable positive findings (comparable, n=2) and with dual imaging providing no complementary information (complementary, n=0). C. Number of patients (total, n=12) for whom imaging with [68Ga]DOTATOC (n=6) or [68Ga]Pentixafor (n=4) was superior, with dual imaging providing complementary and comparable visual information in a single case each (complementary, n=1; comparable, n=1). D. Number of patients (total, n=12) for whom imaging with [18F]FDG (n=5) or [68Ga]DOTATOC (n=4) was superior, with comparable positive findings (comparable, n=2) and with dual imaging providing complementary visual information (complementary, n=1).

