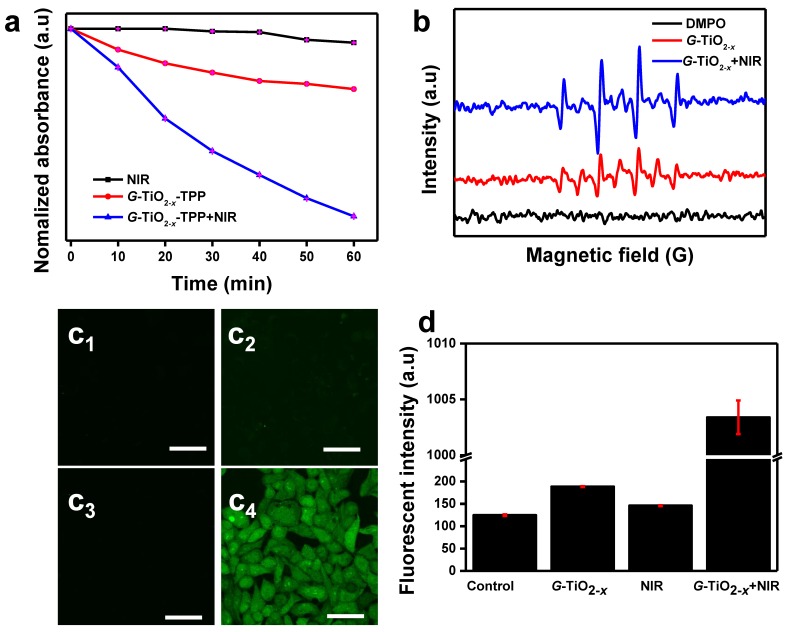
Figure 2.
(a) Time-based absorption intensity (Mean±SD) reduction of DPBF after different treatments, monitored at 410 nm. (b) ESR spectra of different samples. (c)Confocal fluorescence images of HeLa cells stained by DCF-DA after different treatments: (c1): without treatment as a control; (c2): G-TiO2-x incubation alone (Ti concentration: 50 ppm); (c3): NIR laser irradiation alone for 5 min (980 nm, 0.72 W cm-2); (c4): G-TiO2-x+NIR laser irradiation. All the scale bars in (c) are 50 μm. (d) The quantified green fluorescent intensities (Mean±SD) of ROS detection probe DCF from HeLa cell groups after aforementioned different treatments.

