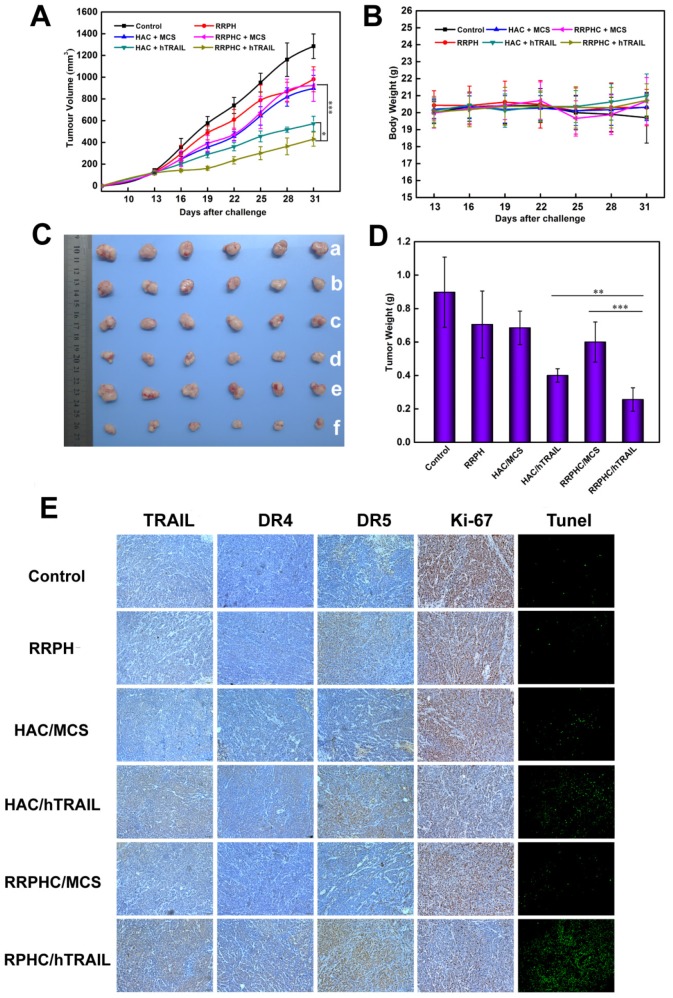
Figure 12.
In vivo anti-tumor activity evaluation. (A) Inhibition of tumor growth in the tumor model with the HCT 116 xenograft after treatment with different formulations. (B) The body weight variation of HCT 116 tumor-bearing mice during treatment. (C, D) Images and tumor weights of HCT 116 tumors after treatment with different formulations at Day 31. (E) Ex vivo IHC analyses of the expression of hTRAIL, DR4, DR5, Ki-67 and TUNEL in tumor sections after treatment with different formulations. *p < 0.05, **p < 0.01 and ***p < 0.001.

