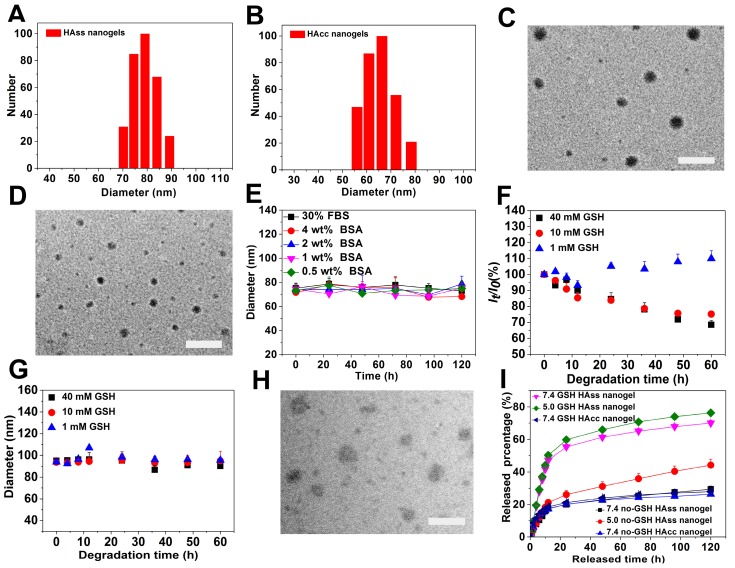
Figure 1.
The DLS plot of (A) HAss nanogels and (B) HAcc nanogels. TEM images of (C) HAss nanogels and (D) HAcc nanogels. The scale bar is 200 nm. (E) The diameter stabilities of HAss nanogels in FBS and BSA solutions (mean ± s.d., n = 3). (F) Light scattering intensity ratio It/Io of HAss nanogels in the presence of 1 mM, 10 mM and 40 mM GSH, respectively against degradation time. Io and Itare the light scattering intensity at degradation time t = 0 and t = t, respectively. (G) The plot of HAss nanogels diameter change with degradation time (mean ± s.d., n = 3). (H) TEM image of HAss nanogels after treated with 10 mM GSH for 24 h. The scale bar is 200 nm. (I) In vitro release plot of DOX from HAss nanogels (pH = 5.0, 7.4) and HAcc nanogels (pH = 7.4) in PBS at 37 °C with or without GSH, respectively (mean ± s.d., n = 3).

