Figure 4.
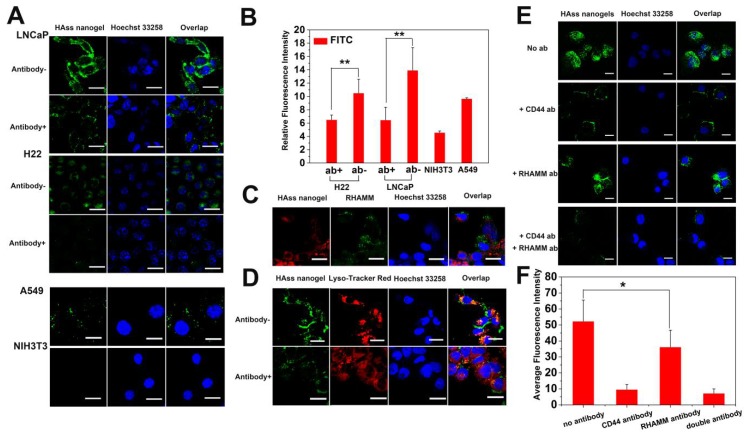
(A) CLSM images of LNCaP, LNCaP treated with anti-RHAMM antibody, H22, H22 treated with anti-RHAMM antibody, A549 and NIH3T3 cells incubated with FITC labeled HAss nanogels (green), respectively. (B) Quantitative analysis of the difference of FITC intensity in LNCaP and H22 with or without anti-RHAMM antibody (ab), A549 and NIH3T3 cells, respectively (mean ± s.d., n = 3). * represents P < 0.05. (C) CLSM images of co-localization between HAss nanogels (red) and anti-RHAMM antibody (green). (D) The co-localization of FITC labeled HAss nanogels and lysosome in LNCaP (up) and LNCaP treated with anti-RHAMM antibody (bottom). (E) The uptake of HAss nanogels (green) in A549 treated with different antibody. (F) semi-quantitative analysis of uptake in A549 treated with different antibody based on CLSM image. The nuclei were stained with Hoechst 33258 (blue). The scale bar in each picture is 10 μm.

