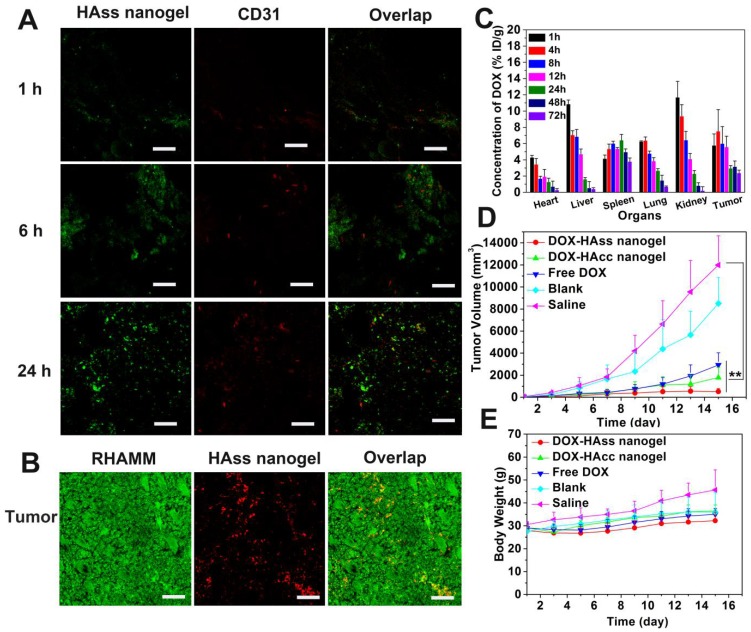
Figure 5.
(A) Penetration of HAss nanogels in tumor at 1 h (up), 6 h (middle) and 24 h (bottom) post-injection. The scale bar is 100 μm. (B) Immunofluorescence staining sections of RHAMM (green) expression in tumor, RBITC-HAss nanogels (red) penetrated in tumor at 24 h post-injection. All cell nuclei are not shown in this figure. The scale bar is 100 μm. (C) Bio-distribution of DOX for DOX-loaded HAss nanogels in H22 subcutaneous tumor-bearing mice. The values were presented as the percentage of ID per gram of collected organs (mean ± s.d., n = 3). (D) Tumor volume of the mice with different administrations as indicated (mean ± s.d., n = 10). ** represents P < 0.01. (E) The weight plot of mice with different administrations (mean ± s.d., n = 10).

