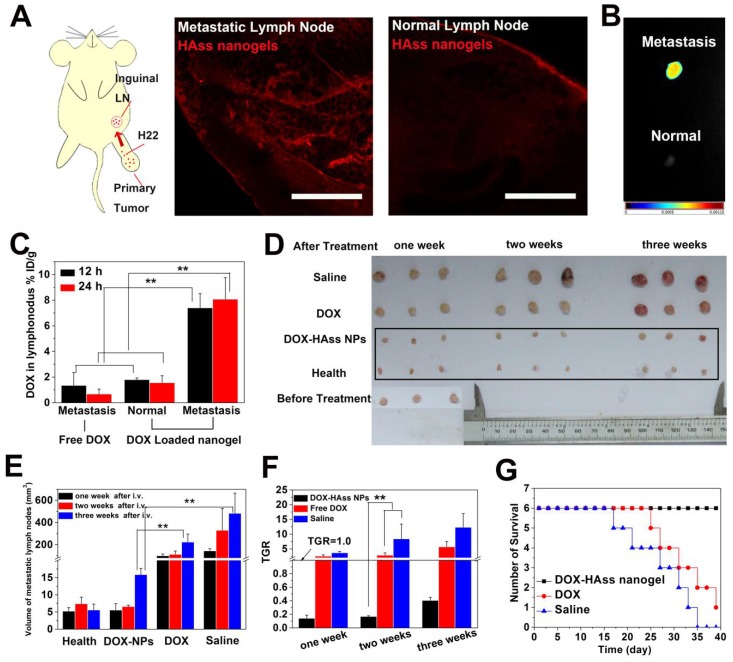
Figure 7.
(A) Diagrammatic drawing of establishing lymph node metastases model in mouse and RBITC-HAss nanogels (red) penetrated in metastatic lymph node (left) and normal one (right) at 2 h post-injection ex vivo. The scale bar is 500 μm. (B) Ex vivo NIR imaging of H22 metastatic lymph node (up) and health lymph node (bottom) following i.v. injection of NIR-797 labeled HAss nanogels. The different fluorescence intensities are represented by different colors as shown in color histogram. (C) Bio-distribution of DOX in lymph node for DOX or DOX-loaded HAss nanogels groups in the mice with H22 lymphatic metastasis at various time points post-injection. The results were presented as % ID/g (n = 3). (D) The photograph of the sizes of lymph node at one week, two weeks and three weeks after treated with saline, DOX and DOX loaded HAss nanogels, respectively. (E) Quantitative statistics of lymph node sizes and (F) tumor growth rate (TGR) of lymph node. The black parallel line represents the TGR = 1.0. All above data are represented as mean ± s.d. (n = 3). ** represents P < 0.01. (G) Survival curves of H22 lymphatic metastasis mice with different treatments (n = 6).

