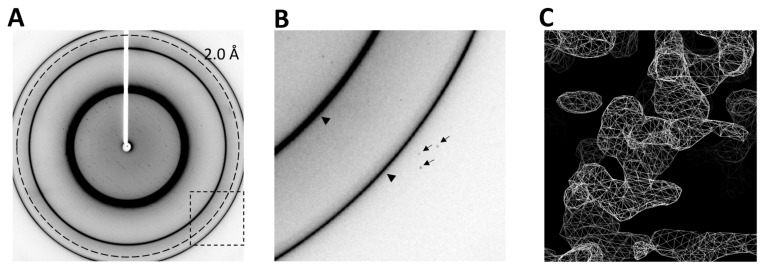
Figure 5.
X-ray diffraction of IE2-CTD crystals. (A) Representative diffraction image collected from an IE2-CTD crystal. The dashed circle represents the resolution at 2.0 Å. The dashed rectangle delineates the area shown in (B). The two sharp rings correspond to ice crystals. (B) Close-up view of (A). High-resolution diffraction spots are indicated by arrows, and ice rings are indicated by arrowheads. (C) Preliminary electron density map (2Fo-Fc) after SAD phasing. An α-helix is clearly visible, and the backbone structure can be easily traced. The map is contoured at 1.5 σ.

