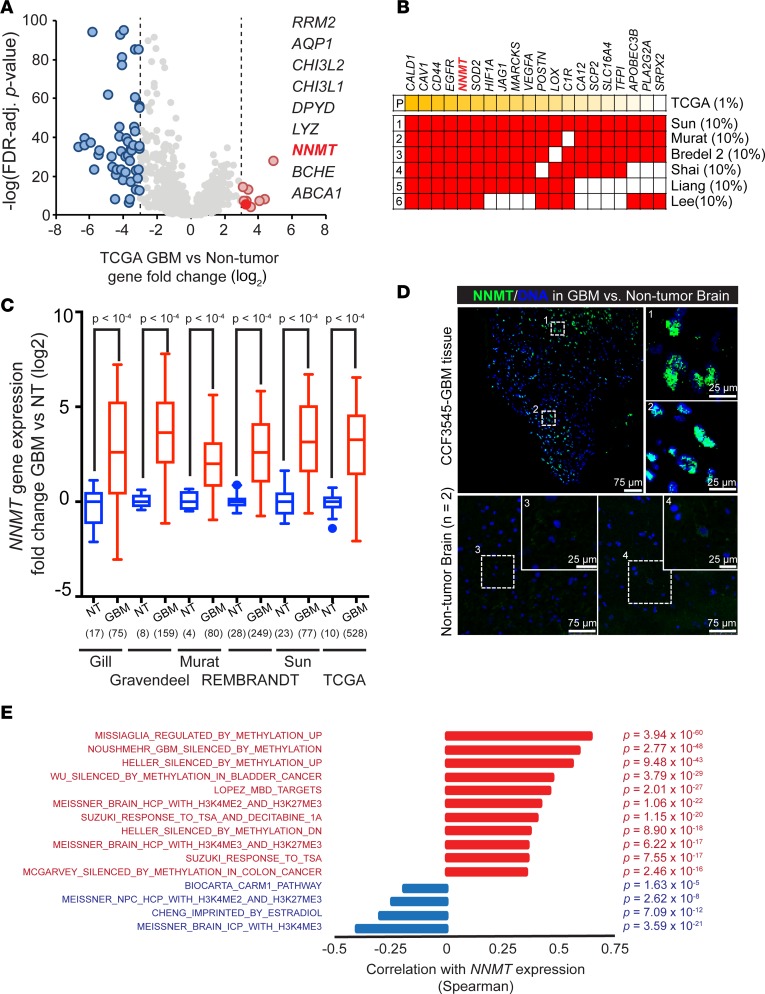
Figure 1. Overexpression of NNMT in glioblastoma.
(A) Fold-change (log2) of metabolic gene expression between glioblastoma and nontumor specimens in the TCGA GBM microarray dataset. (B) Top 10% of genes overexpressed in glioblastomas vs. nontumor samples in 6 glioblastoma expression databases cross-referenced with top 1% of genes overexpressed in glioblastomas vs. nontumor samples from the TCGA dataset by the unsupervised analysis tool in Oncomine. (C) Fold-change of NNMT mRNA expression between glioblastoma (GBM) and nontumor brain (NT) in glioblastoma expression datasets. Sample sizes as indicated on the figure. (D) Representative images of patient glioblastoma tissues with NNMT staining, out of 2 total experiments. Frozen glioblastoma sections were stained with anti-NNMT antibody and DAPI. Scale bars: 75 μm and 25 μm, respectively. (E) Waterfall plot of correlation between NNMT mRNA expression and cancer or neural precursor methylation signature scores in the TCGA GBM microarray dataset. Spearman correlation coefficients with FDR-adjusted P < 0.001 and R > 0.2 or R < –0.2 were considered significant.

