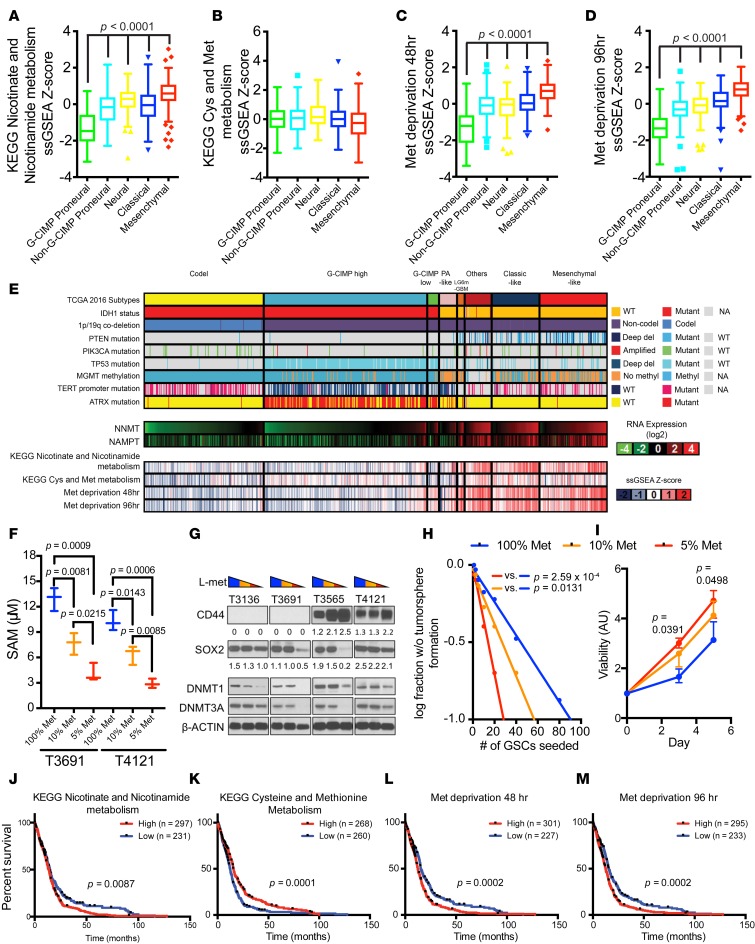
Figure 4. Reduced expression of DNMT1 and DNMT3A by methionine depletion.
(A–D) KEGG nicotinate and nicotinamide metabolism, KEGG cysteine (Cys) and methionine (Met) metabolism, Met deprivation 48 hr, and Met deprivation 96 hr gene set signature score distribution by molecular subtypes (G-CIMP proneural, n = 41; non–G-CIMP proneural, n = 97; neural, n = 84; classical, n = 145; mesenchymal, n = 156) in TCGA GBM microarray dataset. (E) NNMT and NAMPT mRNA expression and KEGG nicotinate and nicotinamide metabolism, KEGG cysteine and Met metabolism, Met deprivation 48 hr, and Met deprivation 96 hr gene set signature score distribution in TCGA pan-glioma (GBMLGG) RNAseq dataset (codel, n = 167; G-CIMP high, n = 236; G-CIMP low, n = 17; PA-like, n = 11; others, n = 39; classical-like, n = 69; mesenchymal-like, n = 98) (6). (F) SAM measurements 3 days after culturing in media of different Met concentrations (100% Met, 115.5 μM; 10% Met, 11.5 μM; 5% Met, 5.75 μM). (G) Immunoblot performed using indicated antibodies under the 3 media conditions. T3136 and T3691 are proneural GSCs; T3565 and T4121 are mesenchymal GSCs. CD44 and SOX2 band intensities were normalized to respective β-actin band intensities. (H) In vitro limiting dilution assay and (I) cell viability assay of T4121 GSCs cultured in different Met-restricted conditions. (J–M) Patient survival data in the TCGA GBM microarray dataset. A given gene signature was evaluated as high (ssGSEA Z score > 0) or low (ssGSEA Z score < 0) (Supplemental Figure 5).

