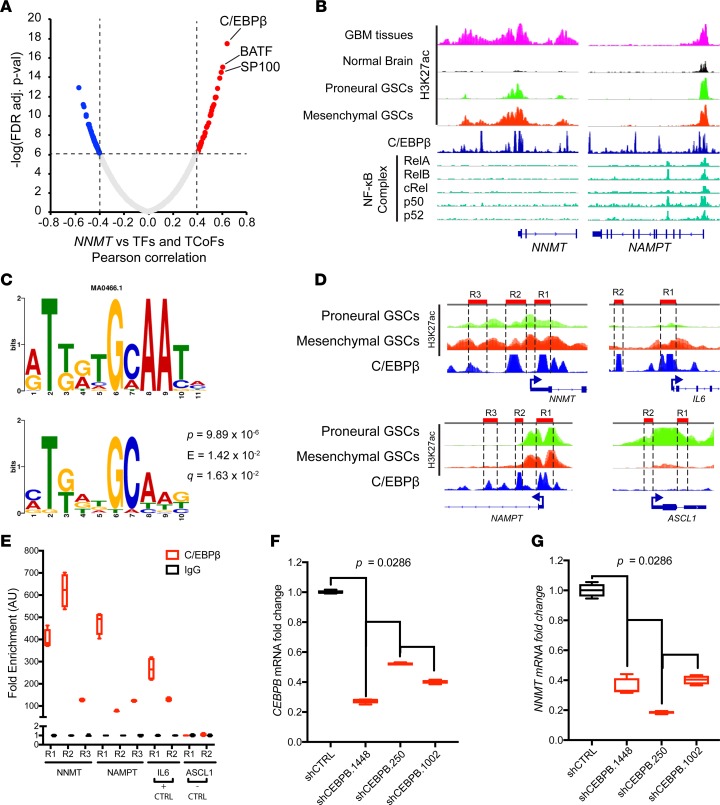
Figure 8. C/EBPβ promotes upregulation of nicotinamide metabolism genes.
(A) Correlation between NNMT and transcription factors and transcription coactivators in TCGA GBM RNAseq dataset. Pearson correlation test was used to evaluate relationship. TF, transcription factor; TCoF, transcription cofactor. (B) ChIP-seq analysis of glioblastoma samples and published datasets visualized on IGV 2.3.80: H3K27ac ChIP-seq data from glioblastoma tissues (n = 5), nonmalignant brain tissue (n = 5), proneural (n = 8 ), and mesenchymal GSCs (n = 8) marking enhancer regions (Stephen C. Mack, unpublished observations); C/EBPβ ChIP-seq from ENCODE database (91, 92); NF-κB complex ChIP-seq data from previously published studies (93, 94). (C) Motif analysis of enhancer regions of upregulated genes of the nicotinamide and nicotinate metabolism pathway (NNMT, NAMPT, MAT2A, AHCY, BST1, and BST2). P value represents the motif offset probability that the match occurred by random chance according to the null model. E value represents the expected number of times that the given query sequence would be expected to match a target motif as well or better than the observed match in a randomized target database of the given size. Q value is the match false discovery rate (84–86). (D) Schema for ChIP-PCR primer design in C/EBPβ ChIP peak-enriched regions in NNMT, NAMPT, IL6, and ASCL1 regulatory regions. (E) ChIP-PCR analysis of NNMT, NAMPT, IL6, and ASCL1 loci in mesenchymal T4121 GSCs. (F and G) RT-PCR of CEBPB and NNMT mRNA in T4121 GSCs transduced with shRNAs targeting CEBPB and NNMT and nontargeting controls (shCTRL).

