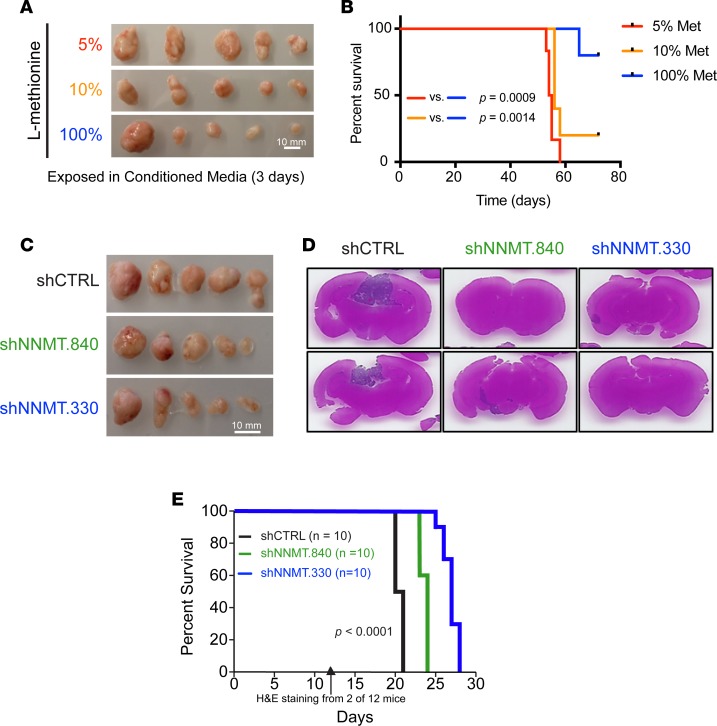
Figure 9. In vivo mesenchymal GSC growth and mice survival rate by methionine restriction or targeting NNMT.
(A) Tumor mass from s.c. implantation of T4121 GSCs cultured under different methionine restriction conditions (100%, 115.5 μM; 10%, 11.5 μM; 5%, 5.75 μM) for 3 days before injection. (B) Kaplan-Meier curve of mice bearing intracranial xenograft of T3136 GSCs cultured for 3 days under different methionine restriction conditions (100%, 115.5 μM; 10%, 11.5 μM; 5%, 5.75 μM) before injection. (C) Tumor mass from s.c. implantation of T4121 GSCs transduced with shCTRL, shNNMT.840, or shNNMT.330 lentivirus. Scale bars: 10 mm. (D and E) H&E staining of tumor-bearing brains and survival of tumor-bearing mice bearing intracranially xenografted T4121 GSCs transduced with shCTRL, shNNMT.840, or shNNMT.330 lentivirus. Cohorts of 12 mice were implanted with tumors from 2 mice in each experimental arm that were randomly selected for sacrifice for H&E staining 2 weeks after implantation, and 10 were used to observe mice survival rate. The P value represents the Mantel-Cox log-rank test of survival analysis.

