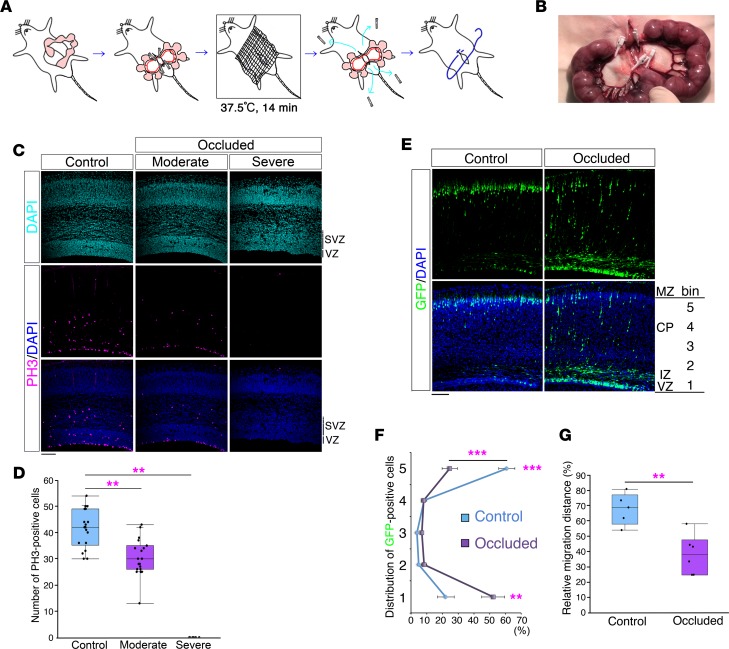
Figure 5. Effect of brain injury on neurodevelopment in the mouse neocortex.
(A) Schematic representation of the procedure for producing the mouse model of brain injury. (B) Representative photograph of maternal uterine arteries occluded with 4 disposable vascular clips. (C) Brains of control embryos (left) and occluded embryos (middle and right) 12 hours after occlusion. Sections were immunostained with anti-PH3 antibody (counterstained with DAPI). SVZ, subventricular zone; VZ, ventricular zone. Scale bar: 100 μm. (D) The numbers of PH3-positive cells in the VZ and SVZ are shown (control: n = 18, moderate: n = 19, severe: n = 6). A Kruskal-Wallis test followed by Dunnett’s post-hoc test was used. **P < 0.01. (E) After transfection of GFP expression plasmid at E15.0, a sham operation (Control) or maternal uterine artery occlusion (Occluded) was performed at E16.5. Brains were analyzed at P1 (counterstained with DAPI [blue]). MZ, marginal zone; CP, cortical plate. Scale bar: 100 μm. (F) Cell distribution was evaluated by bin analysis. Data obtained in 5 control brains and 6 occluded brains (mean ± SEM) are shown. **P < 0.01, ***P < 0.001, repeated-measures ANOVA followed by Bonferroni post-hoc test. (G) Relative migration distances (%) from the ventricle. Average relative migration distances in 5 control brains and 6 occluded brains are shown. **P < 0.01, Student’s t test. (D and G) Each point represents an individual mouse. Box-and-whisker plots were used to graphically represent the median (line within box), upper and lower quartiles (bounds of box), and maximum and minimum values (top and bottom bars).

