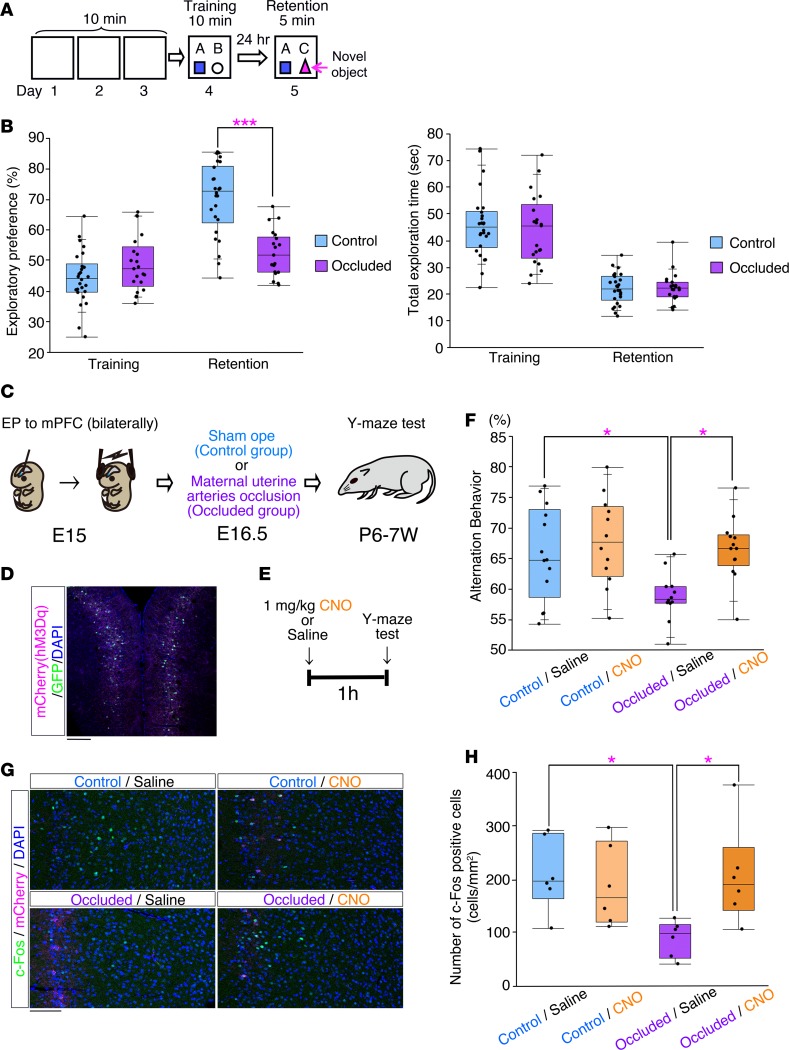
Figure 8. The mouse model had cognitive impairments.
(A) Schematic representation of the novel object recognition test. (B) Performance in the novel object recognition test (Control: n = 26, Occluded: n = 21). Left: exploratory index. Right: total exploration time. ***P < 0.001, repeated-measures ANOVA followed by Bonferroni post-hoc test. (C) Schematic representation of bilateral in utero electroporation into the mPFC at E15.0. An hM3Dq-mCherry–expressing vector (pCAG-hM3Dq-mCherry) was coelectroporated with pCAG-EGFP, followed by a sham operation (control) or maternal uterine artery occlusion (Occluded) at E16.5. (D) A representative image of the mPFC transfected with a GFP expression vector and hM3Dq-mCherry expression vector at E15.0 and fixed at P7 weeks. The section was stained with anti-RFP (magenta) antibody. Scale bar: 200 μm. (E) Scheme showing the time course of the injection of CNO or control saline and the behavioral test. (F) The graph indicates the spontaneous alternation behavior in the Y-maze test of the control/saline (n = 13), control/CNO (n = 12), occluded/saline (n = 12), and occluded/CNO (n = 13) mice. *P < 0.05, Tukey-Kramer test. (G) c-Fos expression in the prelimbic (PrL) region of the mPFC was analyzed by immunohistochemistry in the saline- and CNO-treated mice 2 hours after the Y-maze test. Images show representative examples of c-Fos expression in the PrL. Scale bar: 100 μm. (H) Quantitative analysis of the number of c-Fos–positive cells in the PrL from the control/saline, control/CNO, occluded/saline, and occluded/CNO mice (n = 6, respectively). *P < 0.05, Tukey-Kramer test. (B, F, and H) Each point represents an individual mouse. Box-and-whisker plots were used to graphically represent the median (line within box), upper and lower quartiles (bounds of box), and maximum and minimum values (top and bottom bars).

