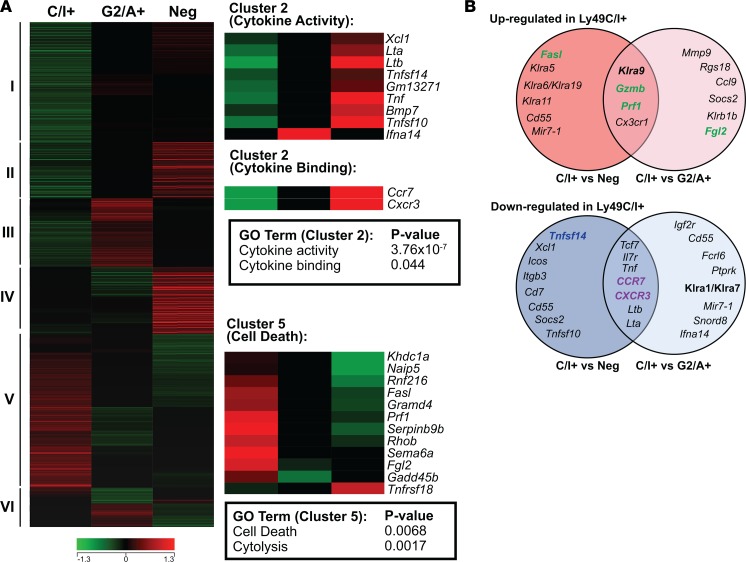
Figure 6. Microarray gene expression profiling of NK cell subsets.
Total RNA was isolated from pools of licensed (CD3–CD122+Ly49G2–A–Ly49C/I+) and unlicensed (CD3–CD122+Ly49G2+Ly49A+Ly49C/I– or CD3–CD122+Ly49G2–Ly49A–Ly49C/I–) NK cell populations isolated by FACS of splenocytes from 30 naive C57BL/6 mice. Gene expression profiling was performed with Affymetrix mouse Gene ST microarrays as described in the Methods. Genes differentially expressed between the 3 NK cell subsets (Ly49-negative, Ly49-C/I+, and Ly49-G2/A+) were determined and subsequently utilized in downstream hierarchical clustering and gene functional classification. (A) Differentially expressed genes between the NK cell subsets were identified and clustered according to similarities in their expression patterns. The different clusters are labeled I to VI (left of heatmap). Heatmaps also depict the relative expression of genes comprising significantly enriched functional genes (i.e., gene ontology terms) within the licensed (cluster V) and unlicensed (cluster II) NK subset expression signatures (right-hand side of panel). (B) Overlap of genes that are commonly upregulated (top Venn diagram) in the Ly49C/I+ NK cell subset compared with either the Ly49-negative (left circle) or Ly49G2/A+ (right circle), or that are downregulated (bottom Venn diagram) in the Ly49C/I+ NK cell subset compared with either the Ly49-negative (left circle) or Ly49G2/A+ (right circle). Color indicates function of molecule encoded: green, effector molecule; purple, trafficking molecule; blue, secreted molecule.

