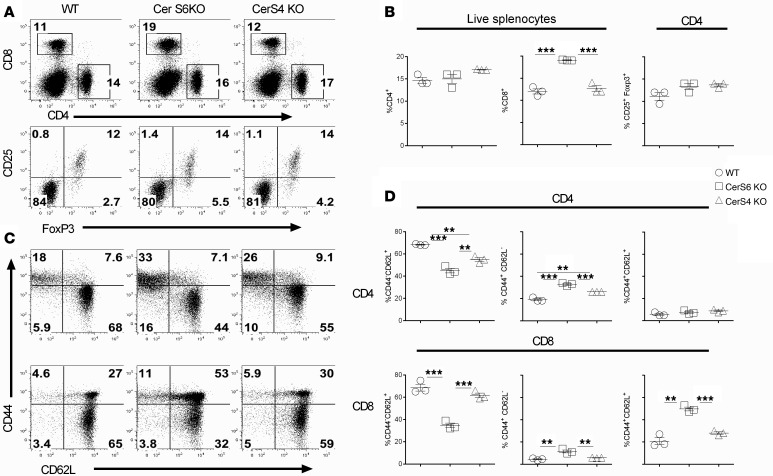
Figure 1. Effects of ceramide synthase 4 or ceramide synthase 6 on T cell phenotype.
Spleens were obtained from unmanipulated age- and sex-matched WT, ceramide synthase 4 (CerS4) KO, or ceramide synthase 6 (CerS6) KO mice on a B6 background. Splenocytes were individually processed, counted, and stained for the expression of CD4, CD8, Foxp3, CD44, and CD62L. (A and B) Percentages of CD4+ or CD8+ cells on total live splenocytes, percentages of CD25+Foxp3+ cells on gated CD4+ cells, and (C and D) CD44 and CD62L expression on gated CD4+ or CD8+ cells are shown. (A and C) Data shown are from 1 representative mouse. The data are from 1 representative experiment of 3 independent experiments (mean ± SD with 3 mice per group). Significance was determined by using ANOVA test. **P < 0.01, ***P < 0.001.

