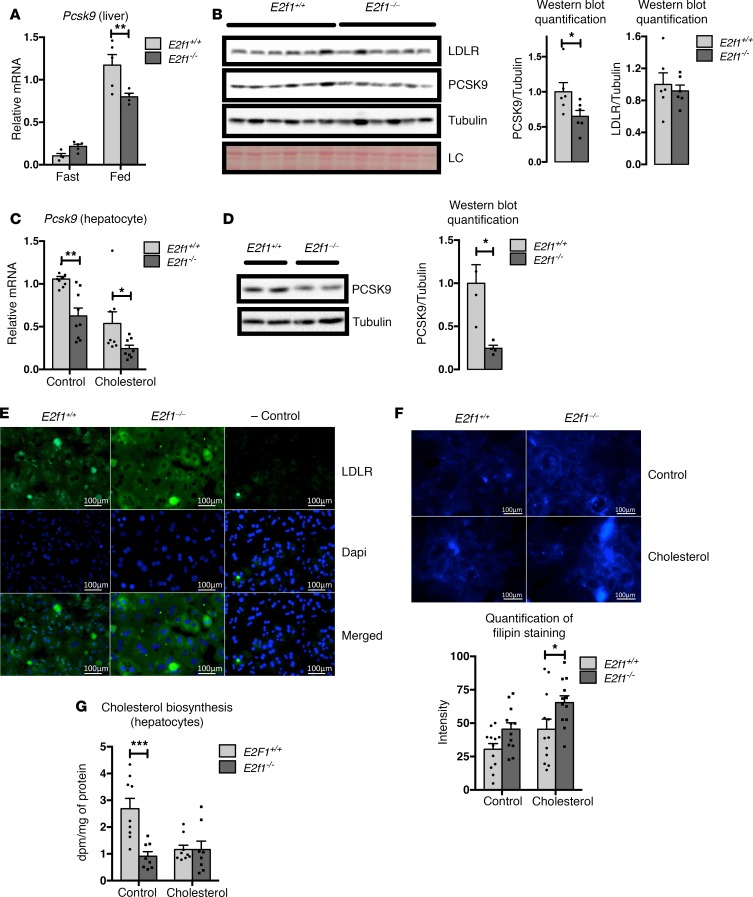
Figure 3. Loss of E2f1 decreases Pcsk9 expression and increases LDLR protein expression in hepatocytes.
(A) Relative expression of Pcsk9 mRNA in livers from E2f1+/+ and E2f1–/– mice that were fed a normal chow diet or fasted overnight. (B) Western blot of PCSK9 and LDLR in the livers of E2f1+/+ and E2f1–/– mice. Ponceau staining of the membrane are shown as a loading control (LC). Normalizations of the quantified values are represented. Differences between E2f1+/+ and E2f1–/– were determined by 2-tailed unpaired t test. *P < 0.05. (C) Relative expression of Pcsk9 mRNA in primary E2f1+/+ and E2f1–/– mouse hepatocytes treated with medium supplemented with DMSO (control, ctrl) or 0.065 mg/ml cholesterol (chol). Three independent experiments in triplicate. (D) Representative images of PCSK9 Western blots from primary E2f1+/+ and E2f1–/– mouse hepatocytes in medium with cholesterol. Tubulin was used as a loading control (n = 2). Normalization of the quantified values is represented. Differences between E2f1+/+ and E2f1–/– were determined by 2-tailed unpaired t test. *P < 0.05. (E) Representative images of LDLR immunostaining in primary E2f1+/+ and E2f1–/– mouse hepatocytes (n = 3). Experiments were independently repeated 3 times. LDLR is stained in green; nuclei are stained in blue. Scale bars: 100 μm. (F) Filipin staining of E2f1+/+ and E2f1–/– mouse hepatocytes (n = 3). Quantification of the intensity of filipin staining are represented. Scale bars: 100 μm. (G) Quantification of the rate of cholesterol biosynthesis in E2f1+/+ and E2f1–/– mouse hepatocytes treated with medium supplemented with DMSO (ctrl) or 0.065 mg/ml cholesterol (chol). All data are presented as the mean ± SEM. Differences between E2f1+/+ and E2f1–/– were determined by 2-way ANOVA unless indicated otherwise. *P < 0.05, **P < 0.01, ***P < 0.005.

