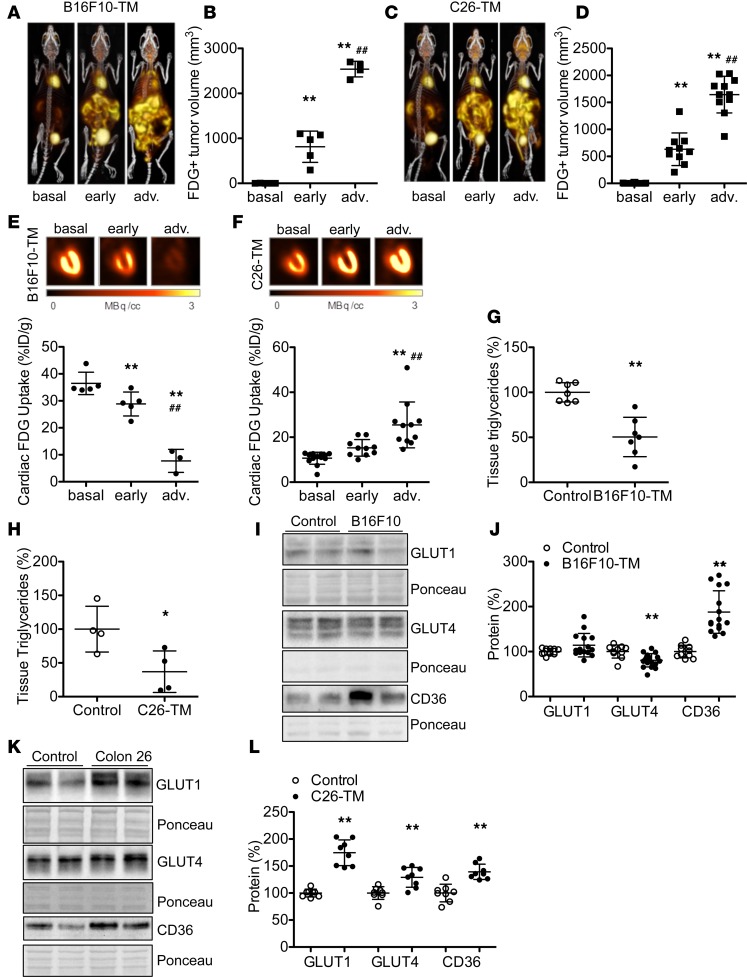
Figure 2. Effect of progressive tumor growth on myocardial glucose uptake and metabolism.
(A and C) Serial 3D maximum intensity projection 18F-fluorodeoxyglucose PET–computed tomography (18F-FDG PET-CT) images of representative B16F10-TM or C26-TM mice, (B and D) 18F-FDG–derived metabolic tumor volume, and (E and F) serial representative long-axis myocardial 18F-FDG PET images, with graphs summarizing quantitative uptake (percentage injected dose per gram tissue [%ID/g]) before tumor inoculation (basal) and at early (day 7 after tumor cell inoculation) and at advanced disease stage (adv.; day 11–17) in B16F10-TM (n = 3–5) and C26-TM (n = 13) mice. (G and H) Triglyceride levels in myocardial tissue of B16F10-TM mice and respective controls (n = 7 each) or C26-TM mice versus corresponding controls (n = 4 each). (I and K) Western blots and (J and L) quantitative protein levels normalized to Ponceau S staining of glucose transporters GLUT1 and GLUT4 and fatty acid translocase CD36 in B16F10-TM mice (n = 15–18) and controls (n = 10) and in C26-TM mice and controls (n = 8 each), all analyzed at advanced disease stage. Healthy control mice were injected with PBS as vehicle. Data are depicted as mean ± SD; *P < 0.05, **P < 0.01 vs. respective control or basal state, ##P < 0.01 vs. early disease stage, using either 2-tailed Student’s unpaired t tests with Welch’s correction as required (G, H, J, and L) or 1-way ANOVA followed by Bonferroni post-hoc tests as required (B, D, E, and F).

