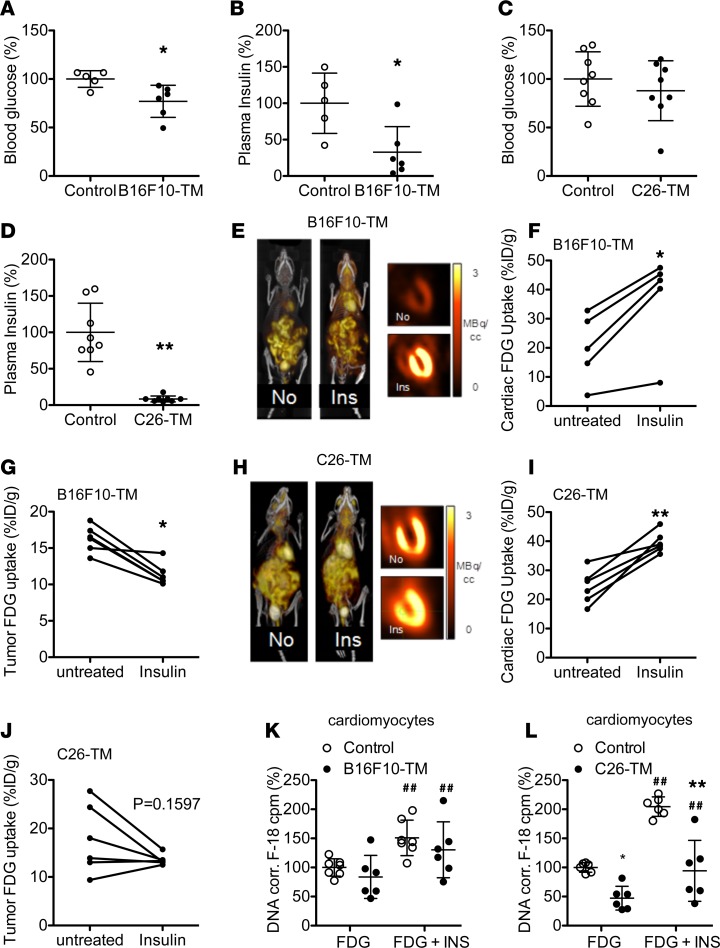
Figure 3. Effect of acute insulin treatment on cardiac and tumor glucose uptake in B16F10-TM and C26-TM mice.
(A and C) Blood glucose concentration after oral glucose load (3 mg/g, 15 minutes after loading) and (B and D) corresponding plasma insulin concentrations in B16F10-TM mice (n = 6 vs. control, n = 5) and C26-TM mice (vs. control, n = 8 each). (E and H) Sample 3D maximum intensity projection 18F-FDG PET-CT and coronal myocardial images obtained in representative B16F10-TM or C26-TM mice, without (No) and with insulin (Ins) pretreatment (6 mU/g; 30 minutes prior to scan) on consecutive days. (F and I) Semiquantitative serial assessment of heart and (G and J) of the tumor 18F-FDG uptake (percentage injected dose per gram of tissue [%ID/g]) without and with insulin in B16F10-TM (n = 5) and C26-TM (n = 6) mice. (K and L) 18F-FDG uptake within 60 minutes in isolated cardiomyocytes from B16F10-TM (n = 6 vs. control, n = 7) and C26-TM (vs. control, n = 6 each) mice, with and without insulin (INS, 50 nM); stimulation was measured in triplicates for each individual and corrected to DNA content. Healthy control mice were injected with PBS as vehicle. Data are depicted as mean ± SD; *P < 0.05, **P < 0.01 vs. control or untreated mice, ##P < 0.01 vs. unstimulated cardiomyocytes, using either 2-tailed Student’s unpaired (A–C) or paired (F, G, I, and J) t tests, Mann-Whitney (D) test, or 2-way ANOVA followed by Bonferroni post-hoc tests as required (K and L).

