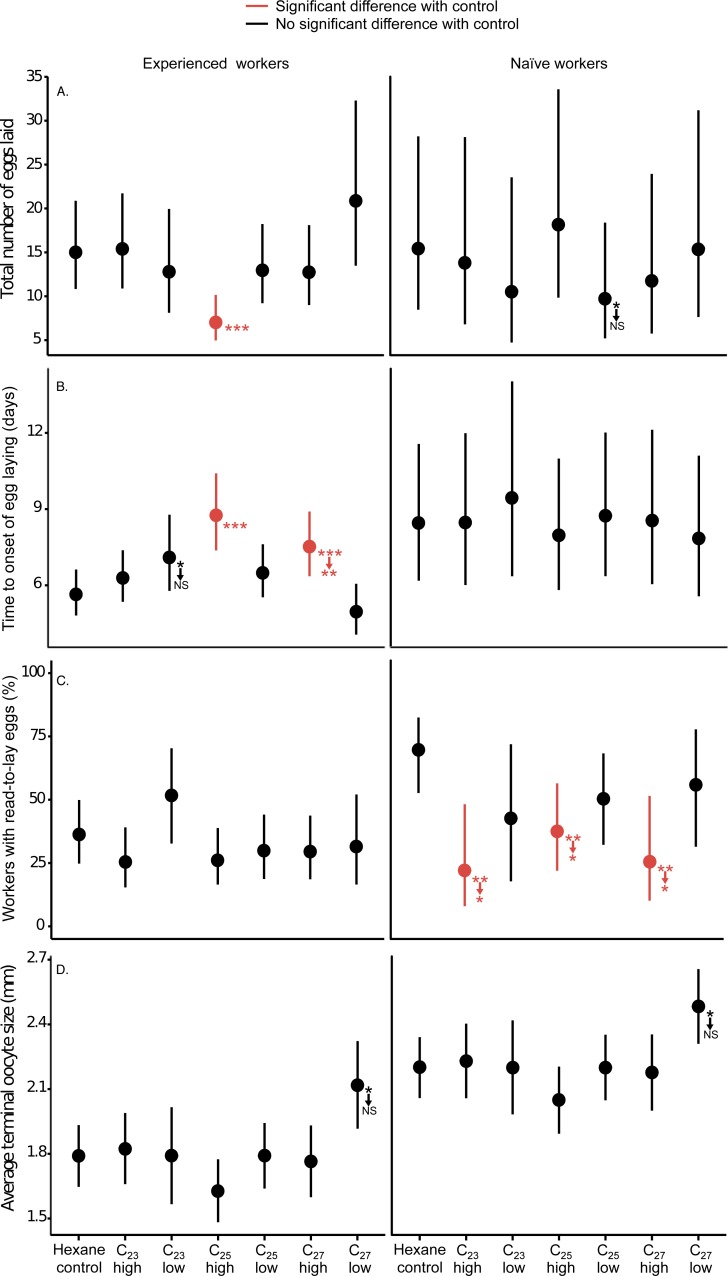
Figure 1. The least-square means (and their 95% confidence limits) for each hydrocarbon treatment, calculated from models shown in Tables S4–S7.
Significant 2-tailed differences with the appropriate hexane control in planned contrasts are indicated using asterisks (∗∗∗, p < 0.001, ∗∗, p < 0.01, ∗, p < 0.05; NS, p > 0.05). Results for which the significance level changed following Benjamini–Hochberg false discovery rate correction are indicated with downward arrows pointing to the new significance level. The results of corresponding fixed effect GLMs and Bayesian GLMMs were largely concordant and are presented in Tables S4–S7.

