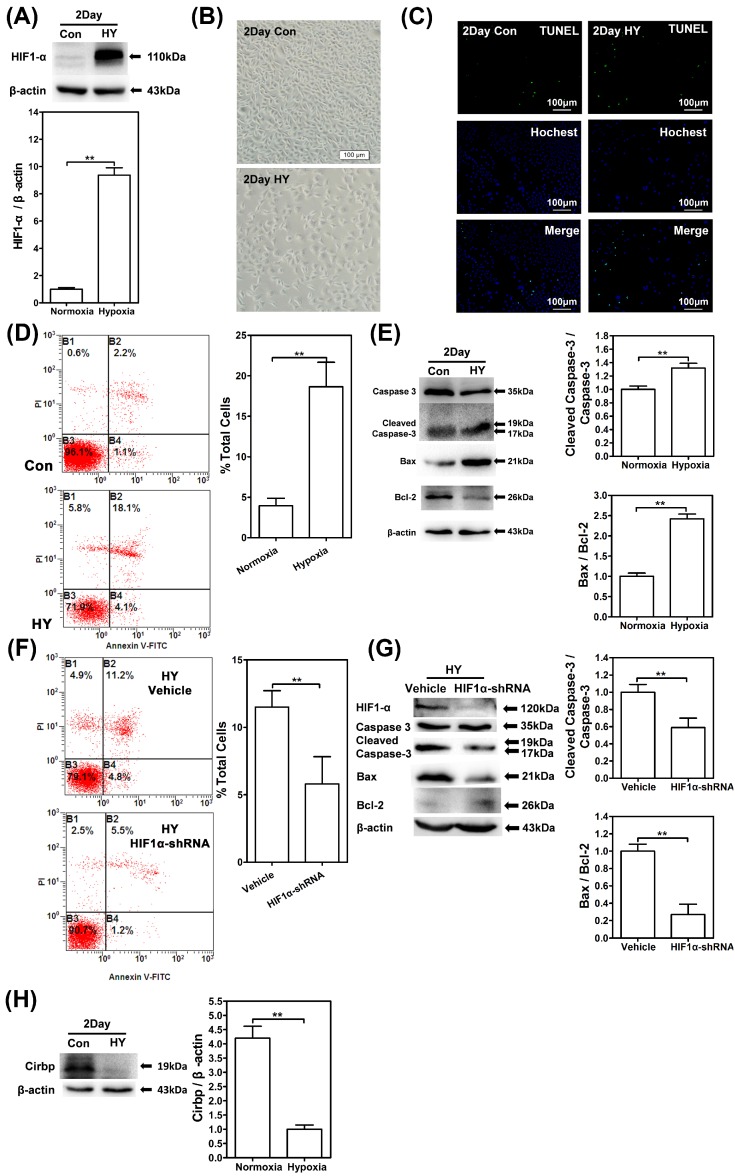
Figure 2.
Chronic hypobaric hypoxia exposure could induce cell apoptosis and significant decreased CIRBP expression in SH-SY5Y cells. (A) Western blot analysis of HIF-1α in in SH-SY5Y cells cultured under normoxia or 1% hypoxia for 48 hours. Notice the significant increase of HIF-1α in the hypoxia group compared with control group. ** (p < 0.01). (B) Photomicrographs of SH-SY5Y cells cultured under normoxia or hypoxia for 48 hours. There was a decrease of cell density under light microscope in the hypoxia group compared with the control group. (C) TUNEL apoptosis detection of SH-SY5Y cells cultured under normoxia or 1% hypoxia for 48 hours. Increased TUNEL-positive cells were observed in hypoxia group compared with the control group. Bars = 100 μm. (D) Flow cytometry shows apoptosis of SH-SY5Y cells by Annexin V and PI staining in control or hypoxia group for 48 hours. 1*106 cell were counted for each group. B1 necrotic cells; B2 late apoptotic cells; B3 viable cells; B4 early apoptosis. Bar graphs demonstrating higher ratio of apoptotic cells in hypoxia group compared with control. ** (p < 0.01). (E) Western blot analysis of caspase-3, cleaved caspase-3, Bcl-2, Bax and β-actin in SH-SY5Y cells cultured under normoxia or 1% hypoxia for 48 hours. Graphs show relative ratio of cleaved caspase-3/caspase-3 and Bax/Bcl-2. Notice the significant increase of cleaved caspase-3/caspase-3 and Bax/Bcl-2 ratio in the hypoxia group compared with the control group, respectively. ** (p < 0.01). (F) Flow cytometry shows apoptosis of SH-SY5Y cells transfected with HIF-1α shRNAs and vehicle control exposed in 1% oxygen concentration for 48h. Bar graphs demonstrating lower ratio of apoptotic cells transfected with HIF-1α shRNAs compared with cells transfected with vehicle control. ** (p < 0.01). (G) Western blot analysis of HIF-1α, caspase-3, cleaved caspase-3, Bcl-2, Bax and β-actin in SH-SY5Y cells transfected with HIF-1α shRNAs and vehicle control exposed in 1% oxygen concentration for 48h. Graphs show relative ratio of cleaved caspase-3/caspase-3 and Bax/Bcl-2. Notice the decrease of cleaved caspase-3/caspase-3 and Bax/Bcl-2 ratio in HIF-1α shRNAs transfected cells compared with vehicle transfected cells respectively. ** (p < 0.01). (H) Western blot analysis of CIRBP expression in SH-SY5Y cells cultured under normoxia or hypoxia for 48 hours. There was significant decrease of CIRBP expression in the hypoxia group compared with the normoxia group. ** (p < 0.01).

