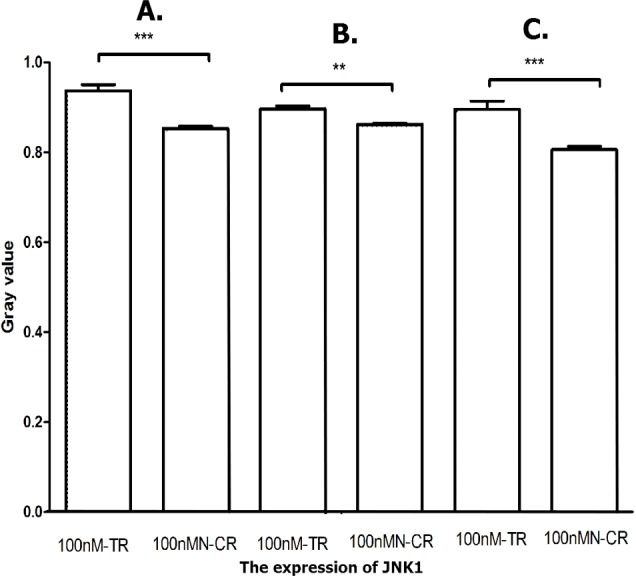
Figure 18. Overexpressed hsa-miR-138-2-3p activated JNK1/MAPK pathway.

The vertical and horizontal axis stand for Gary value and treaments, respectively. It suggested that the expression of JNK1 between 100nM-TR and 100nMN-CR of Hep-2 (A), M2e (B) and TU212 (C) CSCs were significant difference (** P < 0.01, *** P < 0.001).
