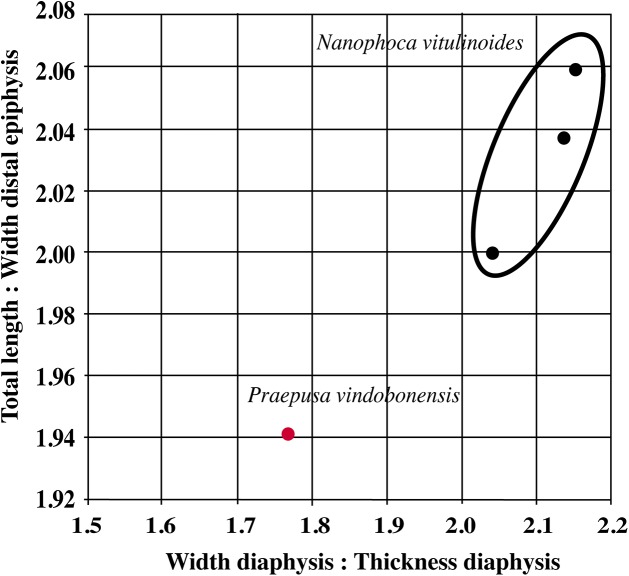
Figure 16. Scatterplot of femur measurements of contemporaneous small Phocinae from the Neogene North Sea and Paratethys basins.
Scatterplot based on the femur measurements shown in Table S11. Black represents Nanophoca vitulinoides, and red the average of over 20 Praepusa vindobonensis specimens. The black ellips encompasses all N. vitulinoides measurements. For the selected characters, the femur of N. vitulinoides differs noticeably from that of the average of P. vindobonensis specimens.

