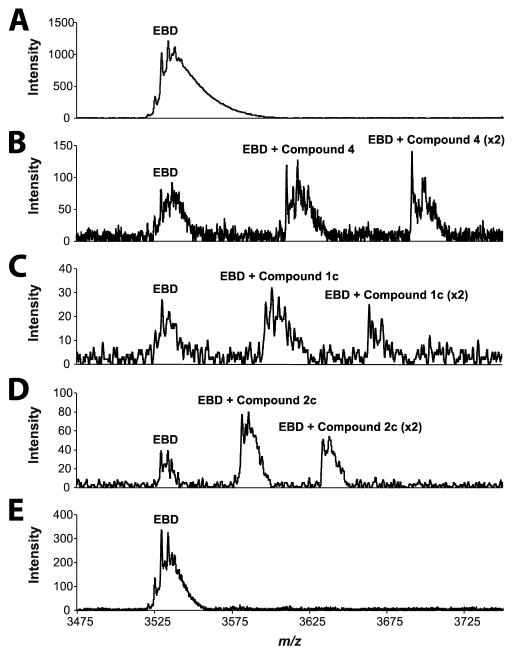
Figure 2.
Representative extracted-ion chromatogram (+14 charge state) of non-denaturing mass spectrometry displaying the AmpR EBD as an intact dimer and in complexes with muropeptides. The spikes in the signals represent multiple adducts of ammonium acetate from the matrix to the various species. (A) AmpR EBD (20 μM) alone. (B) AmpR EBD (20 μM) + 4 (500 μM). (C) AmpR EBD (20 μM) + 1c (500 μM). (D) AmpR EBD (20 μM) + 2c (1 mM). (E) AmpR EBD (20 μM) + 2a (1 mM). Refer to Figure S3 for additional substrate concentrations.

