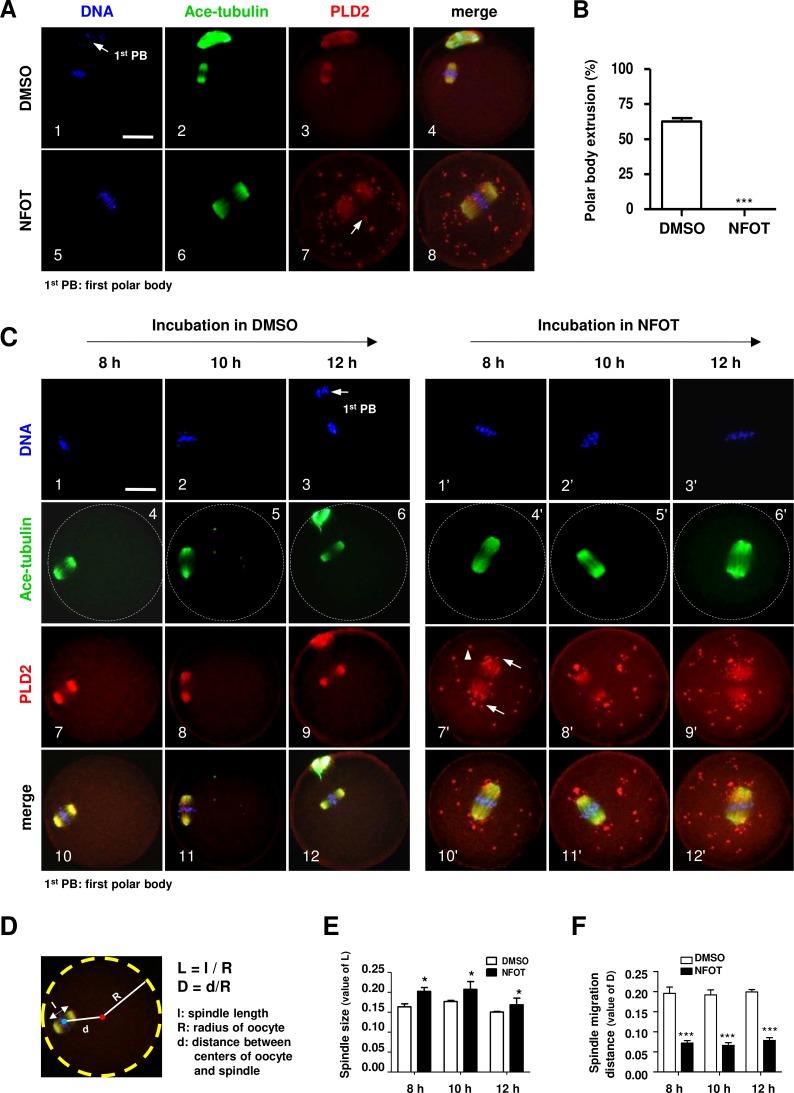
Figure 2. PLD2 inhibition resulted in center-positioned spindle and arrested meiotic progression.
GV oocytes were in vitro cultured for 8 h, 10 h, 12 h and 17 h, respectively, in maturation medium with 20 mM NFOT, and then collected for immunofluorescence analysis. Oocytes incubated with only DMSO was used as control. The experiment was repeated at least three times with more than 30 oocytes analyzed in each group every time. DNA was labeled in blue, microtubules were in green and PLD2 was in red. Scale bar = 20 µM. (A) Representative images showed center-positioned spindle with enlarged size and meiotic arrest at MI after 17 h incubation in NFOT (5–8), PLD2 was labeled on spindle and also exhibited as big dots located in the polar area and cytoplasm (7: arrow). Control oocytes developed to MII stage with normal spindle size and PLD2 distribudtion (1–4, arrow: first polar body, 1st PB). (B) Result of statistical analysis demonstrated the number of MII oocytes, manifested with extruded 1st PB, was significantly lower in NFOT group after 17 h incubation (P < 0.001). (C) Representative images showed spindle status and meiotic progression in oocytes when checked at 8 h, 10 h and 12 h (4’–6’), in NFOT-treated oocytes, meiotic progressed was arrested at the MI stage with enlarged spindle nearly at the center area, PLD2 was labeled on spindle and also as large dots in area near to spindle poles (7’: arrows) and across the cytoplasm (7’: arrowhead). In oocytes incubated with DMSO alone, the spindle was assembled in normal size and positioned in the cortex (4, 5), PLD2 was co-localized with microtubules on spindle (7–9), some oocytes were progressed to MII stage when checked at 12 h (3, 6, 8, 12: arrow: 1st PB). (D) Computational method for measurement of spindle size and migration distance. A red dot indicates the spherical center of oocytes and a blue dot indicates the center of spindle, “l” indicates the length of spindle long axis, “R” indicates the spherical radius of oocytes, and “d” indicates the distance from spindle center to spindle center; “L” is the ratio value between “l” and “R” (L = l∕R), representing the relative length of spindle structure, “D” is the ratio value between “d” and “R”, indicating the relative distance of spindle migration. “l”, “R”, and “d” values were obtained using Image-Pro Plus 6.0 software. (E) The results of statistical analysis indicated the spindle size (“L” value) was significantly bigger in NFOT-treated oocytes than that in control when analyzed at 8 h, 10 h and 12 h of drug incubation (P < 0.05). (F) Statistical data indicated the distance of spindle migrating to the cortex (“D” value) was significantly smaller in NFOT-treated oocytes than that in control when analyzed at 8 h, 10 h and 12 h of drug incubation (P < 0.001).

