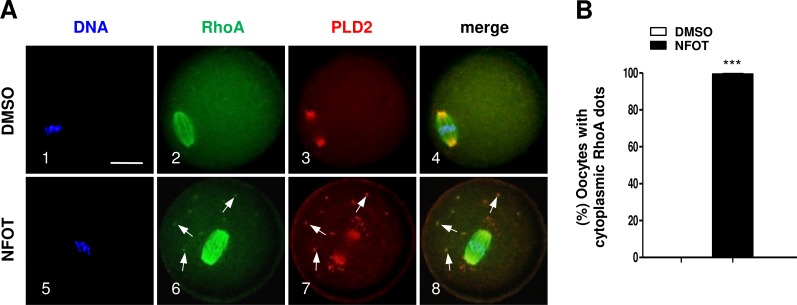
Figure 8. NFOT treatment changed RhoA cytoplasm distribution.
Oocytes at GV stage were incubated for 8 h with or without NFOT, and then fixed for immunostaining of PLD2 and RhoA. This experiment was repeated three times, with 50 oocytes included in each group every time. DNA was labeled in blue, RhoA in green and PLD2 in red. Scale bar = 20 µM. (A) Immunofluorescence showed co-localization of RhoA with PLD2 was only detected in the spindle area in control cells (2–3); however, in NFOT-treated oocytes, RhoA was co-localized with PLD2 in the spindle area, but also aggregated as foci and overlapped with PLD2 dots in cytoplasm (6–8: arrows). (B) Statistical analysis confirmed the proportion of oocytes with cytoplasmic RhoA dots was significantly higher in NFOT group (P < 0.001).

