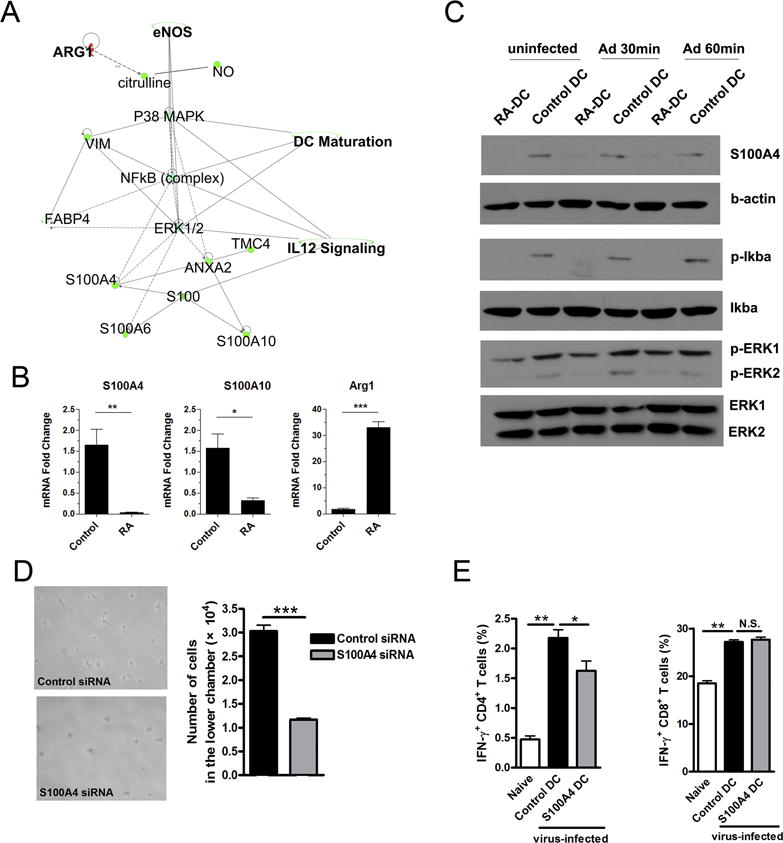
Figure 6. RA regulated S100A protein expression and downstream signaling pathway of DCs.

The proteins from control and RA-treated DC were extracted, digested by trypsin, and labeled (see Materials and Methods section). Labeled peptides were analyzed by using mass spectrometry. (A) Predicted canonical pathways were generated from mass spectrometry data analysis by Ingenuity Pathway Analysis (IPA) Software. (B) Transcript levels of arginase 1, S100A4 and S100A10 in DCs. (C) Control and RA-treated DCs were infected by Ad-LacZ (MOI: 300) for 30 and 60 min, respectively. Shown are western blot analysis of S100A4, p-Iκbα and p-ERK. (D) 2 × 10⁵ control or S100A4 koncodown-DCs were cultured, respectively, in the upper chambers of 24-well transwell plates. The lower chambers contained complete medium with rCCL21 (100 ng/ml). After 8 h of culture, the cells in the lower chambers were collected for photographing and counting. (E) DCs were incubated with S100A4 siRNA or control siRNA for 6 h and cultured for another 3 days, followed by transwell assay (as shown in Fig. 5D) and in vivo T cell priming analysis (as shown in Fig. 5E). Each experiment was repeated at least three times independently. *p < 0.05, **p < 0.01, ***p < 0.001.
