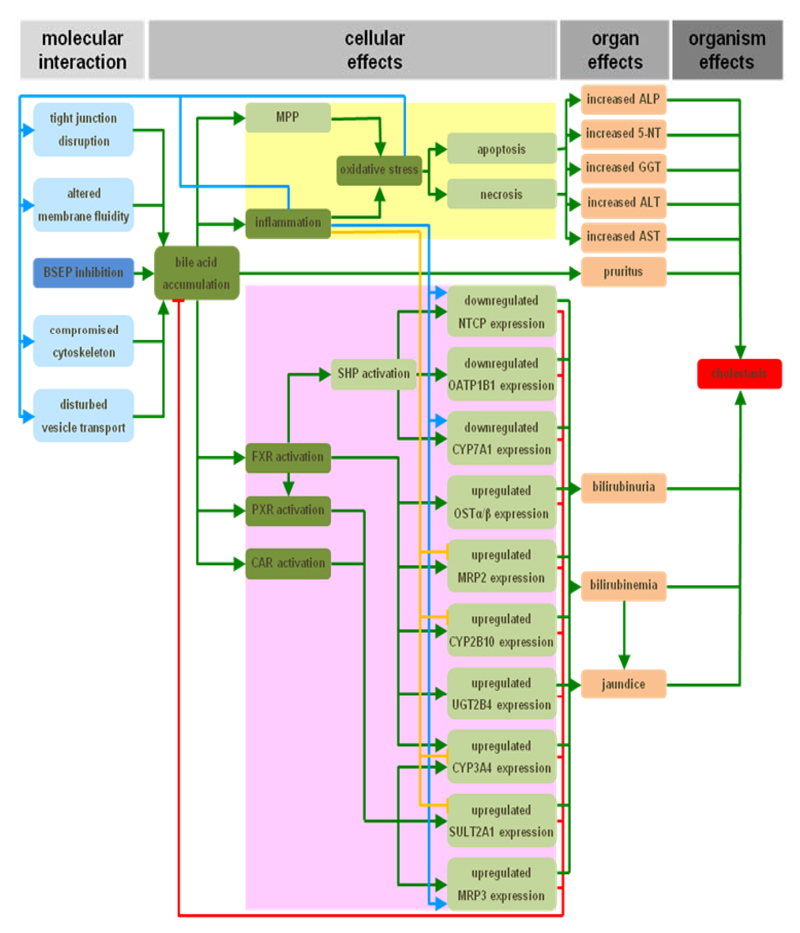
Figure 4. AOP for drug-induced cholestasis.
The response matrix between the MIE (dark blue) and AO (red), the inhibition of the bile salt export pump (BSEP) and cholestasis, respectively, spans over the cellular and organ levels. Identified KEs (dark green) include the accumulation of bile, the induction of oxidative stress and inflammation, and the activation of the nuclear receptors pregnane X receptor (PXR), farnesoid X receptor (FXR) and constitutive androstane receptor (CAR). Together with a number of intermediate steps, these KEs drive both a deteriorative cellular response (yellow), which underlies directly caused cholestatic injury, and an adaptive cellular response (purple), which is aimed at counteracting the primary cholestatic insults. Direct inducing and inhibiting effects are indicated with green and red arrows, respectively. Secondary inducing and inhibiting effects of oxidative stress and/or inflammation are indicated with blue and orange arrows, respectively (31) (5′-NT, 5′-nucleotidase; ALP, alkaline phosphatase; ALT, alanine aminotransferase; AST, aspartate aminotransferase; CYP2B10/3A4/7A1, cytochrome P450 2B10/3A4/7A1; GGT, gamma-glutamyl transpeptidase; MPP, mitochondrial permeability pore; MRP2/3, multidrug resistance-associated protein 2/3; NTCP, sodium/taurocholate cotransporter; OATP1B1, organic anion transporter 1B1; OSTα/β organic solute transporter α/β; SHP, small heterodimeric partner; SULT2A1, dehydroepiandrosterone sulfotransferase; UGT2B4, uridine 5′-diphosphate-glucuronosyltransferase 2B4).

