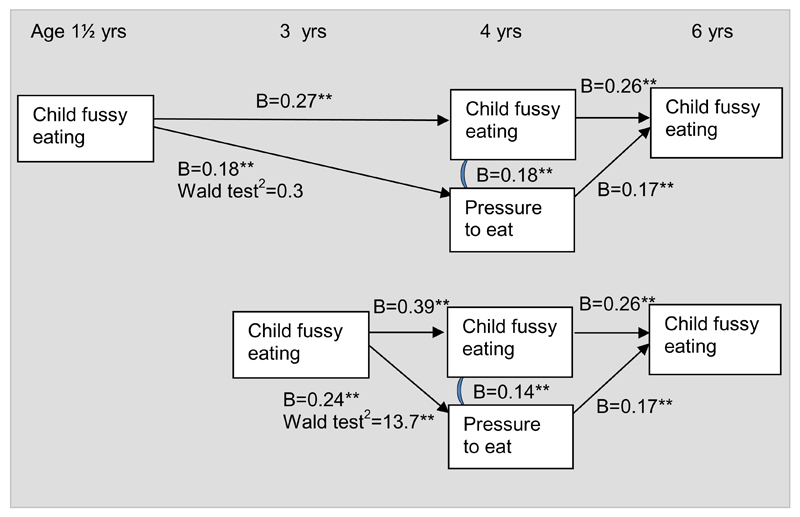
Figure 1. Path model including associations between pressure to eat and fussy eating in both directions (n=4845)1.
Footnotes: *p<0.05, **<0.001.
1Values represent beta’s derived from linear regression analyses (all scale scores expressed in standard deviation scores), adjusted for maternal ethnicity, education, BMI and psychopathology score, child gender, and breast feeding duration.
2Wald tests compare fussy to pressure pathway (from 1½ to 4 years, and 3 to 4 years) with pressure to fussy pathway (4 to 6 years).

