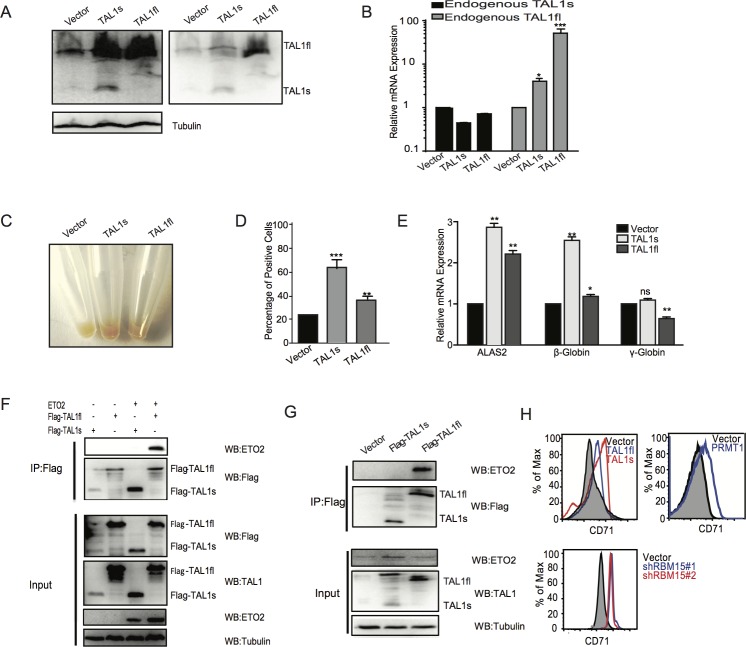
Fig 3. TAL1s promotes erythroid differentiation.
(A) Western blots to confirm the establishment of K562 cells lines expressing TAL1s and TAL1fl respectively. (B) Real-time PCR assays to measure the transcription of endogenous TAL1fl and TAL1s in K562 cells infected with viruses expressing TAL1s and TAL1fl respectively. (C) The pellets of the K562 cell lines expressing TAL1s and TAL1fl respectively were compared. (D) Benzidine staining of K562 cells lines expressing TAL1s and TAL1fl respectively. The percentage of positively stained K562 cells was calculated. (E) The expression levels of ALAS2, β and γ hemoglobin in these established cell lines as listed in panel A. The levels of mRNAs were calculated as mean ± standard deviation from three independent experiments. (F) Co-immunoprecipitation assay with Flag antibody to pulldown Flag-tagged TAL1s and Flag-TAL1fl. 293T cells were transfected with plasmids expressing ETO2 and Flag-tagged TAL1 proteins in combination as indicated above the gel. (G) Co-immunoprecipitation assay with Flag antibody to immunoprecipitate Flag-tagged TAL1s and Flag-TAL1fl. The co-immunoprecipitated ETO2 was detected by anti-ETO2 antibody. K562 cells were used to make stable cell lines to express Flag-tagged TAL1s and Flag-TAL1fl respectively. (H)The percentages of CD71+ erythroid cells were shown in histograms. Human CD34+ cord blood cells were infected with viruses expressing PRMT1, TAL1s, TAL1fl and shRNAs against RBM15 respectively. After grown in EPO containing medium for 10 days, FACS analysis was performed for CD71 labeled cells. P values were calculated using one-way ANOVA and t test (*<0.05, **<0.01, and ***<0.001).

