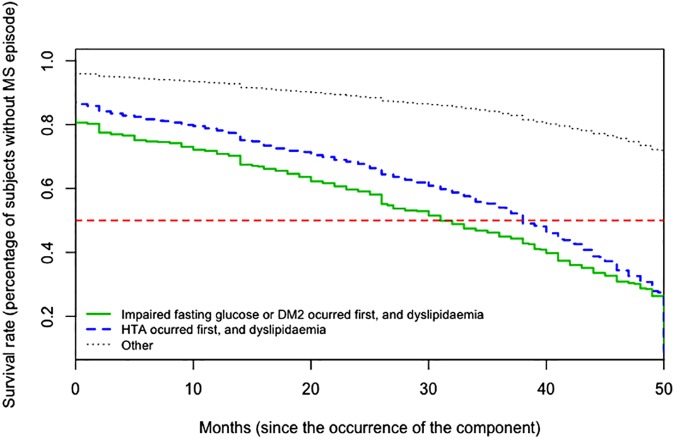
Fig 3. Survival curves.
Survival rate (percentage of subjects without MS episode) from the occurrence of the component, in accordance with the first occurrence of components related to glucose metabolism, combined with dyslipidaemia. The horizontal line represents a 50% probability (of the first MS episode occurring).

