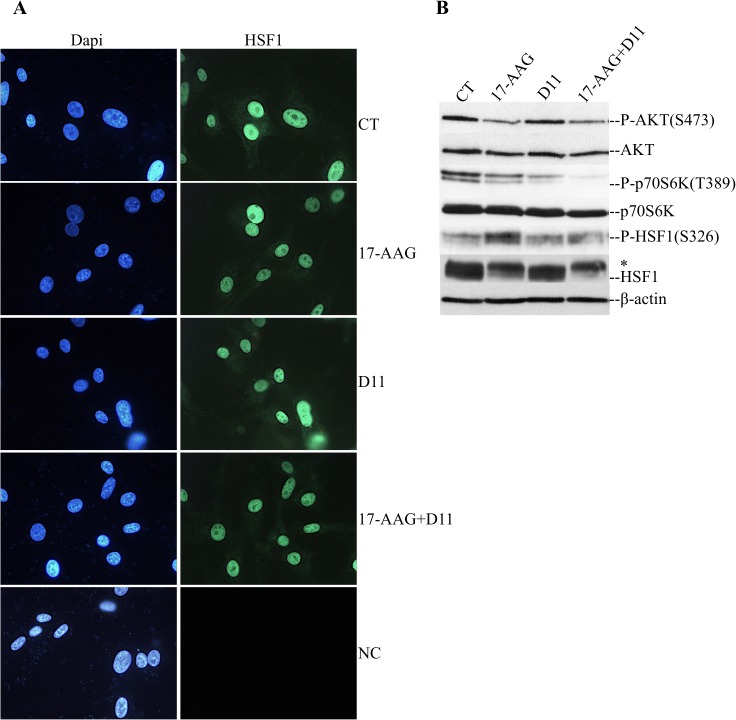
Fig 4. Cell treatment with D11 leads to dephosphorylation of HSF1 at S326.
(A) Fluorescence-based pictures of cells treated with 0.5 μM 17-AAG, 50 μM D11 or the combination for 24 h. Control cells were treated with 0.1% DMSO for 24 h. Cells were labeled with anti-HSF1 antibody and biotin-conjugated secondary antibody. It followed staining with Alexa Fluor 488-conjugated streptavidin. Cell nuclei were visualized with DAPI staining. Cell pictures were taken at 400X magnification. NC: negative control. (B) Cells were treated as described above. Whole cell lysates were analyzed by Western blot employing antibodies against proteins indicated in the figure. The asterisk indicates hyperphosphorylated HSF1. Experiments were repeated three times obtaining similar results.

