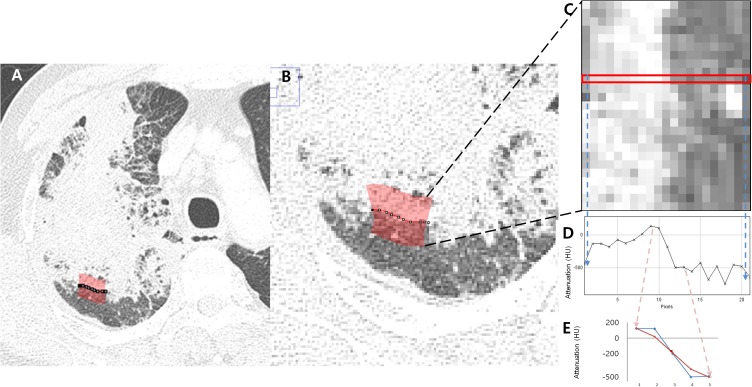
Fig 3. An example of margin-based analysis for obtaining the attenuation slope from lesion to normal lung in invasive mucinous adenocarcinoma.
(A, B) Axial CT image shows an area of margin (red) selected for obtaining the attenuation transition from lesion to normal lung. (C) Pixels in the selected area in (B) were plotted as rectangular boxes with multiple pixels showing the attenuation transition from consolidation (left side) to normal lung (right side). (D) The graph shows the attenuation changes from consolidation (left side) to normal lung (right side) among one of the pixel lines (red box from C). (E) Average attenuation changes within the five pixels from the center of the highest slope in the selected area plotted from the consolidation (left side) to normal lung (right side). HU, Hounsfield unit.

