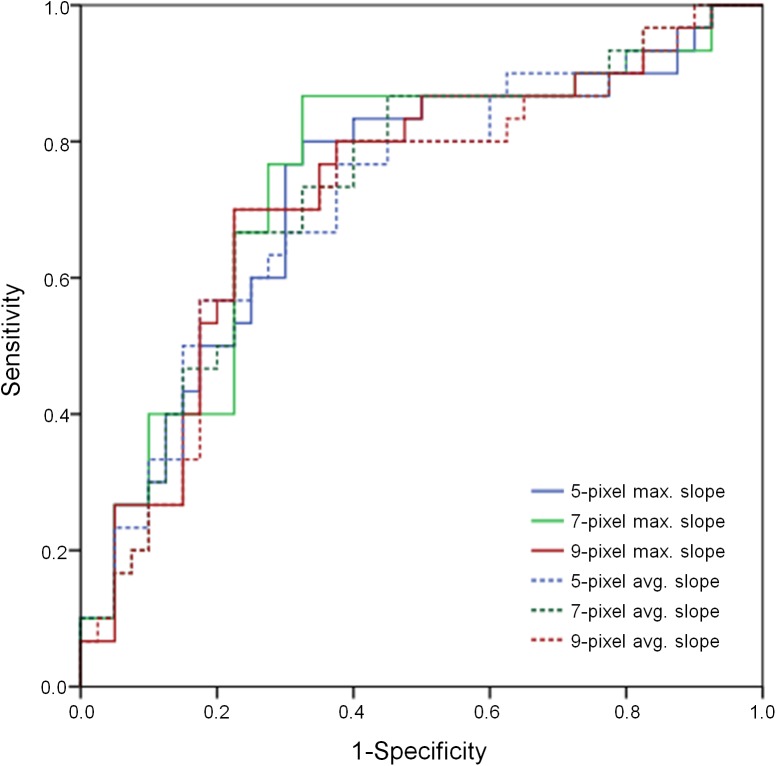
Fig 5. Receiver operating curves showing the diagnostic performance of the attenuation slope at the margin of lesions for differentiating between invasive mucinous adenocarcinoma and bacterial pneumonia manifesting as an air space consolidation.
The C-indices for the graphs are 0.72–0.75, and the highest value is noted at the 7-pixel maximal slope. At a cut-off slope value of -154.21, sensitivity was 86.7% and specificity was 67.5% for the diagnosis of invasive mucinous adenocarcinoma using the 7-pixel maximal slope. max., maximal; avg., average.

