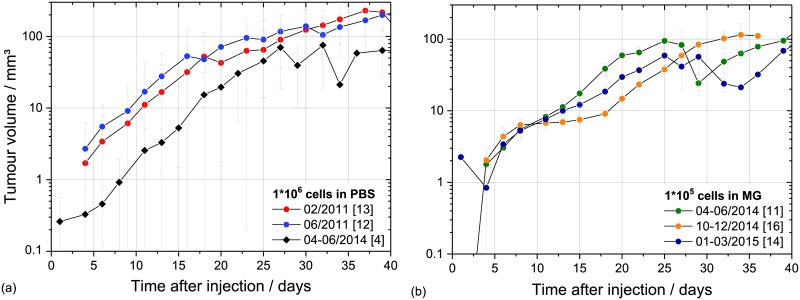
Fig 3. Long-time stability of FaDu mouse ear model.
Long-term stability of the FaDu mouse ear model shown in the averaged tumour growth curves measured after inoculation of 1*106 cells in PBS (a) and of 1*105 cells in MG (b) for the different experiment campaigns. The number of animals is given in brackets; the error bars represent the SEM.

