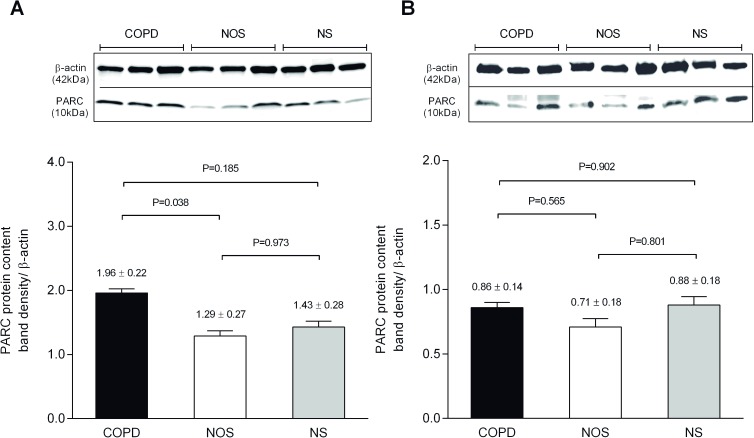
Fig 1. Western blot analysis for PARC.
Upper panel: representative membranes of the Western blotting in homogenized lung tissue (A) and intercostal arteries (B). Bands at 37kD and 10kD are consistent with the size of β-actin and PARC respectively. Lower panel: (A) Band density analysis of 33 lung samples (12 COPD, 11 NOS and 10 NS). Of note, protein content was significantly increased in the COPD group compared to NOS. (B) Band density analysis of 28 intercostal artery samples (12 COPD, 8 NOS and 8 NS). There were no differences in PARC content between groups. Data are presented as LSM ± SEM. The reported p-value comes from the pair wise comparison with a general linear model using as covariables: gender, pack-years and the presence of diabetes mellitus. COPD: Chronic Obstructive Pulmonary Disease; NOS: non-obstructed smokers; NS: never-smokers.

