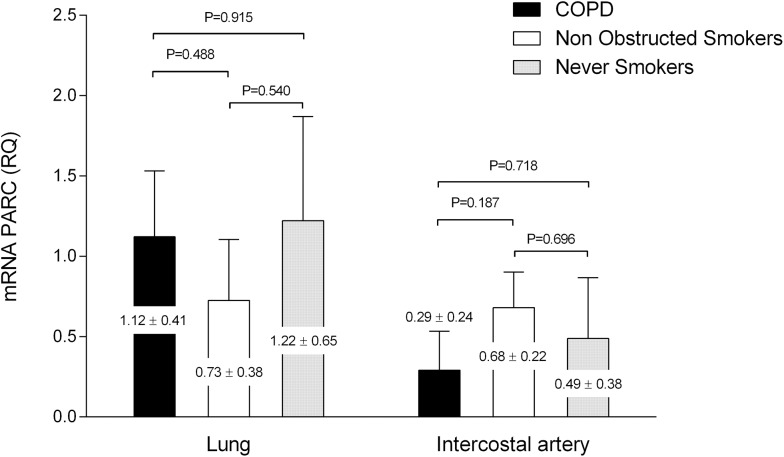
Fig 5. PARC gene expression in according to groups.
Data of the PARC mRNA expression (fold change) in lung tissue and intercostal arteries according to groups. No significant differences were found between groups. Data are presented as LSM ± SEM. The reported p-value comes from the pair wise comparison with a general linear model using as covariables: gender, pack-years and the presence of diabetes mellitus.

